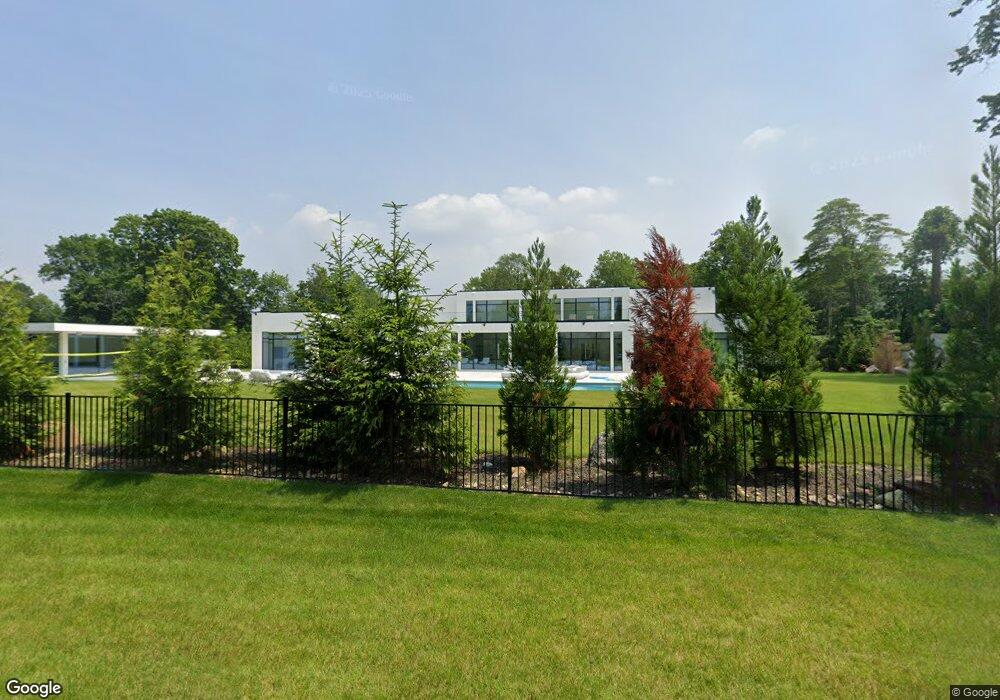
7 Birchwood Ln Great Neck, NY 11024
Estimated Value: $9,338,808 - $10,084,000
8
Beds
11
Baths
15,000
Sq Ft
$647/Sq Ft
Est. Value
About This Home
This home is located at 7 Birchwood Ln, Great Neck, NY 11024 and is currently estimated at $9,711,404, approximately $647 per square foot. 7 Birchwood Ln is a home located in Nassau County with nearby schools including John F Kennedy School, Richard S. Sherman - Great Neck North Middle School, and John L. Miller Great Neck North High School.
Ownership History
Date
Name
Owned For
Owner Type
Purchase Details
Closed on
Dec 18, 2024
Sold by
Bolour Nader
Bought by
Kashimallak Hanna and Kashimallak Farzan
Current Estimated Value
Home Financials for this Owner
Home Financials are based on the most recent Mortgage that was taken out on this home.
Original Mortgage
$6,140,000
Interest Rate
6.85%
Mortgage Type
Seller Take Back
Purchase Details
Closed on
Jul 17, 2022
Sold by
Ebrahimian Robert and Schiffman Larry
Bought by
Bolour Nader
Purchase Details
Closed on
Apr 5, 1997
Create a Home Valuation Report for This Property
The Home Valuation Report is an in-depth analysis detailing your home's value as well as a comparison with similar homes in the area
Home Values in the Area
Average Home Value in this Area
Purchase History
| Date | Buyer | Sale Price | Title Company |
|---|---|---|---|
| Kashimallak Hanna | $7,140,000 | Omni Title Agency | |
| Kashimallak Hanna | $7,140,000 | Omni Title Agency | |
| Kashimallak Hanna | $7,140,000 | Omni Title Agency | |
| Kashimallak Hanna | $7,140,000 | Omni Title Agency | |
| Bolour Nader | $2,700,000 | Your Title Experts | |
| Bolour Nader | $2,700,000 | Your Title Experts | |
| Bolour Nader | $2,700,000 | Your Title Experts | |
| Bolour Nader | $2,700,000 | Your Title Experts | |
| -- | -- | -- | |
| -- | -- | -- | |
| -- | -- | -- |
Source: Public Records
Mortgage History
| Date | Status | Borrower | Loan Amount |
|---|---|---|---|
| Previous Owner | Kashimallak Hanna | $6,140,000 |
Source: Public Records
Tax History Compared to Growth
Tax History
| Year | Tax Paid | Tax Assessment Tax Assessment Total Assessment is a certain percentage of the fair market value that is determined by local assessors to be the total taxable value of land and additions on the property. | Land | Improvement |
|---|---|---|---|---|
| 2025 | $40,223 | $2,488 | $957 | $1,531 |
| 2024 | $6,619 | $2,488 | $957 | $1,531 |
| 2023 | $34,746 | $2,401 | $923 | $1,478 |
| 2022 | $34,746 | $2,488 | $957 | $1,531 |
| 2021 | $36,149 | $2,523 | $1,118 | $1,405 |
| 2020 | $37,632 | $3,614 | $2,993 | $621 |
| 2019 | $34,728 | $3,614 | $2,993 | $621 |
| 2018 | $32,539 | $3,614 | $0 | $0 |
| 2017 | $23,319 | $3,614 | $2,095 | $1,519 |
| 2016 | $29,617 | $5,034 | $2,918 | $2,116 |
| 2015 | $8,871 | $5,163 | $2,993 | $2,170 |
| 2014 | $8,871 | $5,163 | $2,993 | $2,170 |
| 2013 | $8,466 | $5,163 | $2,993 | $2,170 |
Source: Public Records
Map
Nearby Homes
- 145 Arrandale Ave
- 13 Potters Ct
- 6 Morris Ln
- 100 Steamboat Rd
- 14 Martin Ct
- 98 Steamboat Rd
- 70 Candy Ln
- 88 Steamboat Rd
- 199 W Shore Rd
- 20 Martin Ct
- 22 Martin Ct
- 33 Van Nostrand Ave
- 58 Steamboat Rd
- 6 Grady Ct
- 0 Kings Point Rd
- 232 KINGS POINT ROAD Kings Point Rd
- 32 Carriage Rd
- 1 Parkside Dr
- 24 Steamboat Rd
- 11 Brook Ln