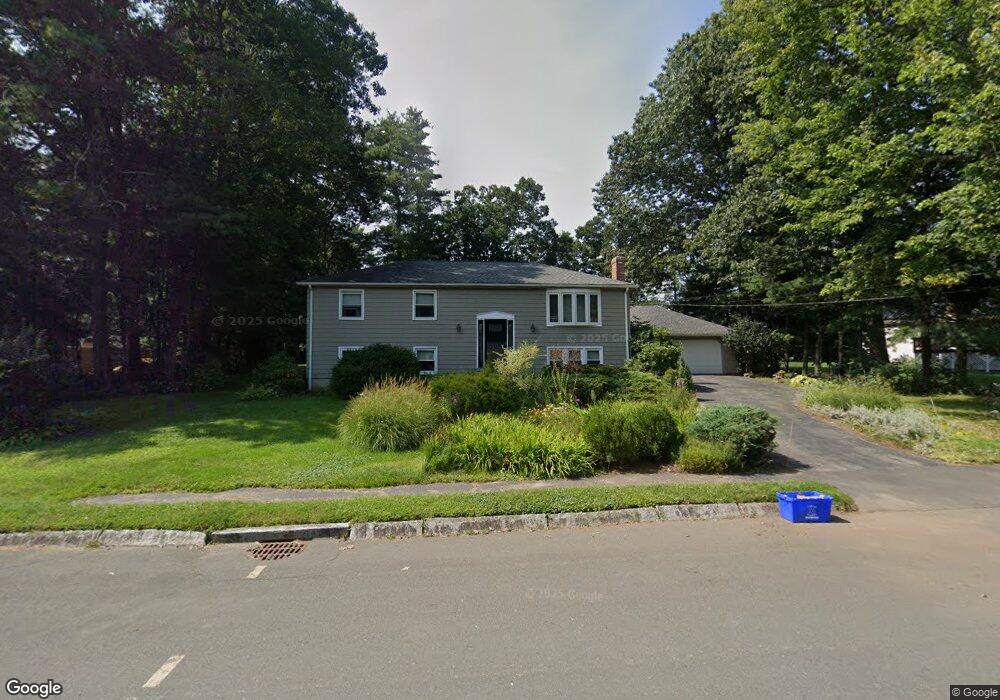
7 Blackington Rd Foxboro, MA 02035
Estimated Value: $648,000 - $769,000
3
Beds
2
Baths
1,336
Sq Ft
$533/Sq Ft
Est. Value
About This Home
This home is located at 7 Blackington Rd, Foxboro, MA 02035 and is currently estimated at $711,451, approximately $532 per square foot. 7 Blackington Rd is a home located in Norfolk County with nearby schools including Foxborough High School, Discovery Daycare Center, and Hands-On-Montessori School.
Ownership History
Date
Name
Owned For
Owner Type
Purchase Details
Closed on
Oct 1, 1990
Sold by
Grkant Thomas
Bought by
Cohen Robert M
Current Estimated Value
Home Financials for this Owner
Home Financials are based on the most recent Mortgage that was taken out on this home.
Original Mortgage
$80,000
Interest Rate
9.95%
Mortgage Type
Purchase Money Mortgage
Create a Home Valuation Report for This Property
The Home Valuation Report is an in-depth analysis detailing your home's value as well as a comparison with similar homes in the area
Home Values in the Area
Average Home Value in this Area
Purchase History
| Date | Buyer | Sale Price | Title Company |
|---|---|---|---|
| Cohen Robert M | $187,000 | -- |
Source: Public Records
Mortgage History
| Date | Status | Borrower | Loan Amount |
|---|---|---|---|
| Open | Cohen Robert M | $30,000 | |
| Closed | Cohen Robert M | $81,000 | |
| Closed | Cohen Robert M | $20,000 | |
| Closed | Cohen Robert M | $80,000 |
Source: Public Records
Tax History
| Year | Tax Paid | Tax Assessment Tax Assessment Total Assessment is a certain percentage of the fair market value that is determined by local assessors to be the total taxable value of land and additions on the property. | Land | Improvement |
|---|---|---|---|---|
| 2025 | $8,462 | $640,100 | $243,700 | $396,400 |
| 2024 | $8,060 | $596,600 | $248,100 | $348,500 |
| 2023 | $7,848 | $552,300 | $236,200 | $316,100 |
| 2022 | $7,218 | $497,100 | $198,000 | $299,100 |
| 2021 | $6,745 | $457,600 | $183,400 | $274,200 |
| 2020 | $6,249 | $428,900 | $183,400 | $245,500 |
| 2019 | $6,156 | $418,800 | $174,700 | $244,100 |
| 2018 | $5,981 | $410,500 | $174,700 | $235,800 |
| 2017 | $5,658 | $376,200 | $163,200 | $213,000 |
| 2016 | $5,741 | $387,400 | $164,600 | $222,800 |
| 2015 | $5,558 | $365,900 | $139,200 | $226,700 |
| 2014 | $5,348 | $356,800 | $130,100 | $226,700 |
Source: Public Records
Map
Nearby Homes
- 25 Shepherd St
- 128 Tremont St
- 346 South St
- 24 Maverick Dr
- 1769 West St
- 40 Treasure Island Rd
- 16 Treasure Island Rd
- 33 Colonial Way
- 9 Coach Rd
- 84 Messenger St
- 46 Mirimichi St
- 150 Gilbert St
- 25 Munroe Dr
- 14 Claire Ave
- 155 South St
- 356 Central St
- 126 Washington St
- 130 Washington St
- 124 Washington St
- 166 Chauncy St
Your Personal Tour Guide
Ask me questions while you tour the home.