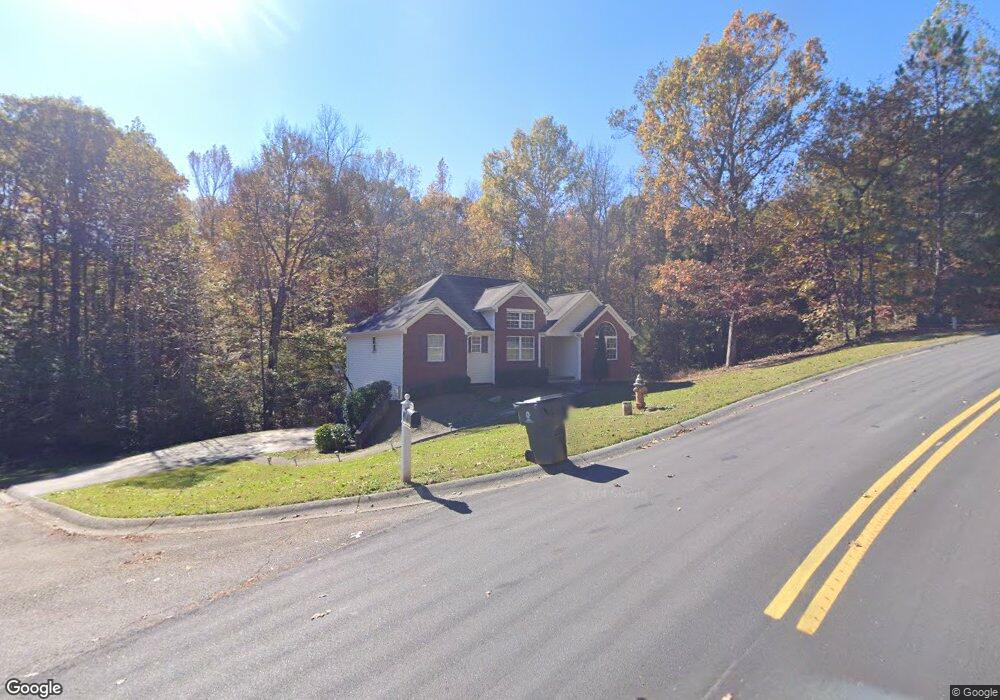
7 Blalock Pkwy Unit 43 Tallapoosa, GA 30176
Estimated Value: $252,734 - $360,000
3
Beds
2
Baths
1,368
Sq Ft
$218/Sq Ft
Est. Value
About This Home
This home is located at 7 Blalock Pkwy Unit 43, Tallapoosa, GA 30176 and is currently estimated at $298,184, approximately $217 per square foot. 7 Blalock Pkwy Unit 43 is a home located in Haralson County with nearby schools including Haralson County High School.
Ownership History
Date
Name
Owned For
Owner Type
Purchase Details
Closed on
Dec 29, 2022
Sold by
Stask Llc Trustee
Bought by
Yes I Am A Pirate Llc
Current Estimated Value
Purchase Details
Closed on
Aug 8, 2018
Sold by
Cosby Christopher B
Bought by
Stask Llc Trustee and Cosby Trust
Purchase Details
Closed on
May 12, 2015
Sold by
Zimmerman Terri
Bought by
Cosby Christopher B and Cosby Brandi A
Home Financials for this Owner
Home Financials are based on the most recent Mortgage that was taken out on this home.
Original Mortgage
$102,606
Interest Rate
3.79%
Mortgage Type
FHA
Purchase Details
Closed on
Sep 25, 2007
Sold by
Citizens Bank Trust Of Wes
Bought by
Zimmerman Teri
Purchase Details
Closed on
Sep 6, 2007
Sold by
Not Provided
Bought by
Zimmerman Terri
Purchase Details
Closed on
Aug 26, 2004
Sold by
Chamblee Associates Llc
Bought by
Flanagan William Kevin
Create a Home Valuation Report for This Property
The Home Valuation Report is an in-depth analysis detailing your home's value as well as a comparison with similar homes in the area
Home Values in the Area
Average Home Value in this Area
Purchase History
| Date | Buyer | Sale Price | Title Company |
|---|---|---|---|
| Yes I Am A Pirate Llc | -- | -- | |
| Stask Llc Trustee | -- | -- | |
| Cosby Christopher B | $104,500 | -- | |
| Zimmerman Teri | $117,000 | -- | |
| Zimmerman Terri | -- | -- | |
| Zimmerman Terri | -- | -- | |
| Flanagan William Kevin | $20,000 | -- |
Source: Public Records
Mortgage History
| Date | Status | Borrower | Loan Amount |
|---|---|---|---|
| Previous Owner | Cosby Christopher B | $102,606 |
Source: Public Records
Tax History Compared to Growth
Tax History
| Year | Tax Paid | Tax Assessment Tax Assessment Total Assessment is a certain percentage of the fair market value that is determined by local assessors to be the total taxable value of land and additions on the property. | Land | Improvement |
|---|---|---|---|---|
| 2024 | $2,769 | $87,912 | $5,088 | $82,824 |
| 2023 | $2,717 | $83,054 | $4,800 | $78,254 |
| 2022 | $1,678 | $67,025 | $4,800 | $62,225 |
| 2021 | $1,497 | $57,526 | $4,800 | $52,726 |
| 2020 | $1,519 | $58,162 | $4,800 | $53,362 |
| 2019 | $1,501 | $55,515 | $4,800 | $50,715 |
| 2018 | $1,456 | $53,279 | $4,800 | $48,479 |
| 2017 | $1,932 | $52,462 | $4,800 | $47,662 |
| 2016 | $1,208 | $41,467 | $4,800 | $36,667 |
| 2015 | $1,375 | $46,922 | $4,800 | $42,122 |
| 2014 | $1,527 | $50,595 | $8,000 | $42,595 |
Source: Public Records
Map
Nearby Homes
- Tract1 Georgia 100
- Tract5 Georgia 100
- Tract4 Georgia 100
- Tract2 Georgia 100
- 1744 Georgia 100
- 281 Lowell Allen Rd
- 610 Old Pleasant Hill Rd
- 280 Levi-Patterson Rd
- 6919 Mount Zion Rd
- 1844 Old Highway 100
- 912 Golf Course Rd
- 967 Old Highway 100
- 0 Highway 100 Unit 10465102
- 2659 Jacksonville Rd
- 419 Lively Rd
- 415 Lively Rd
- 3765 U S 78
- 409 Lively Rd
- 7 Blalock Pkwy
- 129 Gold Creek Dr
- 93 Gold Creek Dr
- 141 Gold Creek Dr
- 100 Gold Creek Dr
- 90 Gold Creek Dr
- 143 Gold Creek Dr
- 80 Gold Creek Dr
- 80 Gold Creek Dr Unit 8
- 73 Gold Creek Dr
- 70 Gold Creek Dr
- 63 Gold Creek Dr
- 0 Overlook Way
- 161 Gold Creek Dr
- 60 Gold Creek Dr
- 0 Gold Creek Dr Unit 10009689
- 0 Gold Creek Dr Unit 6983047
- 0 Gold Creek Dr Unit 8650384
- 0 Gold Creek Dr Unit 8600504
- 0 Gold Creek Dr Unit 8499071