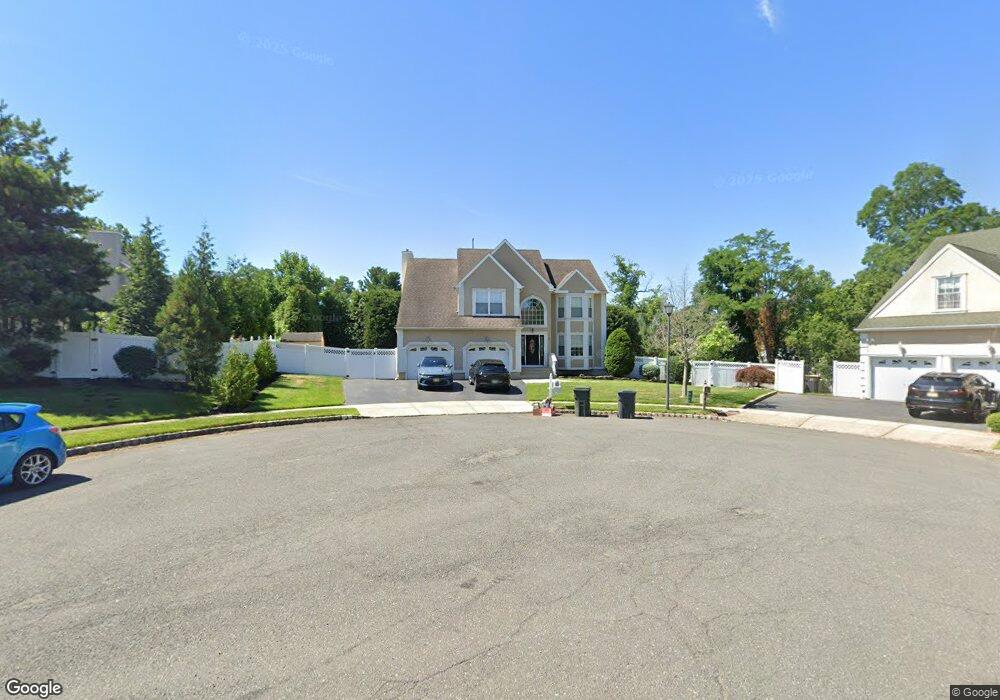
7 Boyd Rd Hazlet, NJ 07730
Estimated Value: $883,000 - $1,027,000
4
Beds
3
Baths
2,508
Sq Ft
$373/Sq Ft
Est. Value
About This Home
This home is located at 7 Boyd Rd, Hazlet, NJ 07730 and is currently estimated at $935,845, approximately $373 per square foot. 7 Boyd Rd is a home located in Monmouth County with nearby schools including Raritan High School, St Benedict School, and St. John Vianney Regional High School.
Ownership History
Date
Name
Owned For
Owner Type
Purchase Details
Closed on
Aug 31, 2009
Sold by
Pellikan Kevin D and Pellikan Christine
Bought by
Guarcello Thomas J and Guarcello Amy C
Current Estimated Value
Home Financials for this Owner
Home Financials are based on the most recent Mortgage that was taken out on this home.
Original Mortgage
$415,000
Outstanding Balance
$273,743
Interest Rate
5.36%
Mortgage Type
New Conventional
Estimated Equity
$662,102
Create a Home Valuation Report for This Property
The Home Valuation Report is an in-depth analysis detailing your home's value as well as a comparison with similar homes in the area
Home Values in the Area
Average Home Value in this Area
Purchase History
| Date | Buyer | Sale Price | Title Company |
|---|---|---|---|
| Guarcello Thomas J | $525,000 | None Available |
Source: Public Records
Mortgage History
| Date | Status | Borrower | Loan Amount |
|---|---|---|---|
| Open | Guarcello Thomas J | $415,000 |
Source: Public Records
Tax History
| Year | Tax Paid | Tax Assessment Tax Assessment Total Assessment is a certain percentage of the fair market value that is determined by local assessors to be the total taxable value of land and additions on the property. | Land | Improvement |
|---|---|---|---|---|
| 2025 | $13,779 | $691,800 | $242,000 | $449,800 |
| 2024 | $13,745 | $655,200 | $202,100 | $453,100 |
| 2023 | $13,745 | $643,200 | $188,800 | $454,400 |
| 2022 | $14,025 | $582,100 | $177,400 | $404,700 |
| 2021 | $14,025 | $546,800 | $186,900 | $359,900 |
| 2020 | $13,914 | $538,900 | $183,100 | $355,800 |
| 2019 | $14,036 | $535,100 | $177,400 | $357,700 |
| 2018 | $13,688 | $517,500 | $172,700 | $344,800 |
| 2017 | $13,394 | $506,400 | $168,400 | $338,000 |
| 2016 | $13,215 | $501,500 | $168,400 | $333,100 |
| 2015 | $12,953 | $492,900 | $168,400 | $324,500 |
| 2014 | $13,136 | $468,800 | $152,700 | $316,100 |
Source: Public Records
Map
Nearby Homes
Your Personal Tour Guide
Ask me questions while you tour the home.