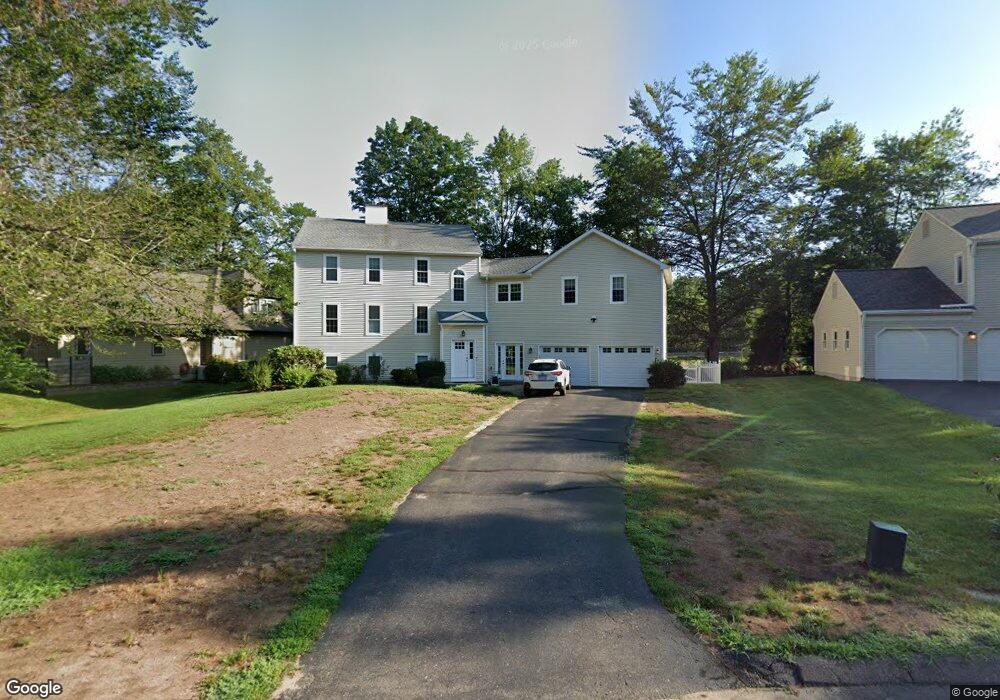
7 Bradley Rd Simsbury, CT 06070
Estimated Value: $448,000 - $604,681
3
Beds
5
Baths
2,588
Sq Ft
$202/Sq Ft
Est. Value
About This Home
This home is located at 7 Bradley Rd, Simsbury, CT 06070 and is currently estimated at $522,420, approximately $201 per square foot. 7 Bradley Rd is a home located in Hartford County with nearby schools including Tariffville School, Henry James Memorial School, and Simsbury High School.
Ownership History
Date
Name
Owned For
Owner Type
Purchase Details
Closed on
Mar 23, 2023
Sold by
Riley Taylor A and Riley Jillian M
Bought by
Shute Zachary and Shute Jenna
Current Estimated Value
Home Financials for this Owner
Home Financials are based on the most recent Mortgage that was taken out on this home.
Original Mortgage
$264,000
Outstanding Balance
$255,697
Interest Rate
6.12%
Mortgage Type
Purchase Money Mortgage
Estimated Equity
$266,723
Purchase Details
Closed on
May 14, 2019
Sold by
Dobra Dinu C and Dobra Kendal R
Bought by
Riley Taylor A and Riley Jullian M
Home Financials for this Owner
Home Financials are based on the most recent Mortgage that was taken out on this home.
Original Mortgage
$228,950
Interest Rate
4%
Mortgage Type
Purchase Money Mortgage
Purchase Details
Closed on
Jun 4, 2007
Sold by
Dolder Peter and Dolder Kathleen C
Bought by
Barcomb Christopher S and Barcomb Jessica R
Purchase Details
Closed on
Mar 26, 1993
Sold by
Wellfleet Corp
Bought by
Dolder Peter and Dolder Kathleen
Create a Home Valuation Report for This Property
The Home Valuation Report is an in-depth analysis detailing your home's value as well as a comparison with similar homes in the area
Home Values in the Area
Average Home Value in this Area
Purchase History
| Date | Buyer | Sale Price | Title Company |
|---|---|---|---|
| Shute Zachary | $330,000 | None Available | |
| Riley Taylor A | $241,000 | -- | |
| Riley Taylor A | $241,000 | -- | |
| Barcomb Christopher S | $354,000 | -- | |
| Dolder Peter | $225,500 | -- | |
| Barcomb Christopher S | $354,000 | -- | |
| Dolder Peter | $225,500 | -- |
Source: Public Records
Mortgage History
| Date | Status | Borrower | Loan Amount |
|---|---|---|---|
| Open | Shute Zachary | $264,000 | |
| Previous Owner | Riley Taylor A | $228,950 | |
| Previous Owner | Dolder Peter | $44,000 | |
| Previous Owner | Dolder Peter | $253,600 |
Source: Public Records
Tax History Compared to Growth
Tax History
| Year | Tax Paid | Tax Assessment Tax Assessment Total Assessment is a certain percentage of the fair market value that is determined by local assessors to be the total taxable value of land and additions on the property. | Land | Improvement |
|---|---|---|---|---|
| 2025 | $11,102 | $325,010 | $74,900 | $250,110 |
| 2024 | $10,826 | $325,010 | $74,900 | $250,110 |
| 2023 | $10,342 | $325,010 | $74,900 | $250,110 |
| 2022 | $9,319 | $241,240 | $79,380 | $161,860 |
| 2021 | $9,319 | $241,240 | $79,380 | $161,860 |
| 2020 | $8,948 | $241,240 | $79,380 | $161,860 |
| 2019 | $9,003 | $241,240 | $79,380 | $161,860 |
| 2018 | $9,068 | $241,240 | $79,380 | $161,860 |
| 2017 | $8,679 | $223,910 | $79,380 | $144,530 |
| 2016 | $8,312 | $223,910 | $79,380 | $144,530 |
| 2015 | $7,305 | $196,800 | $79,380 | $117,420 |
| 2014 | $7,309 | $196,800 | $79,380 | $117,420 |
Source: Public Records
Map
Nearby Homes
- 4 Stebbins Brook Ln
- 3 Stebbins Brook Ln
- 15 Pinnacle Mountain Rd
- 1 West St Unit 206
- 48 Library Ln Unit 48
- 40 Firetown Rd Unit 39
- 3 Cobtail Way
- 9 Cobtail Way
- 308 Hopmeadow St
- 15 Sand Hill Rd
- 16 Stratton Forest Way
- 24 Hunting Ridge Dr
- 10 Butternut Dr
- 5 Butternut Dr
- 545 Simsbury Rd
- 25 Barry Ln
- 119 Wadhams Rd
- 8 Roberts Rd
- 2 Pent Rd
- 10 Foothills Way
- 5 Bradley Rd
- 9 Bradley Rd
- 3 Bradley Rd
- 8 Bradley Rd
- 10 Bradley Rd
- 4 Bradley Rd
- 97 E Weatogue St
- 93 E Weatogue St
- 101 E Weatogue St
- 14 Riverside Rd
- 16 Riverside Rd
- 103 E Weatogue St
- 10 Riverside Rd
- 91 E Weatogue St
- 8 Riverside Rd
- 96 E Weatogue St
- 12 Riverside Rd
- 105 E Weatogue St
- 89 E Weatogue St
- 20 Riverside Rd