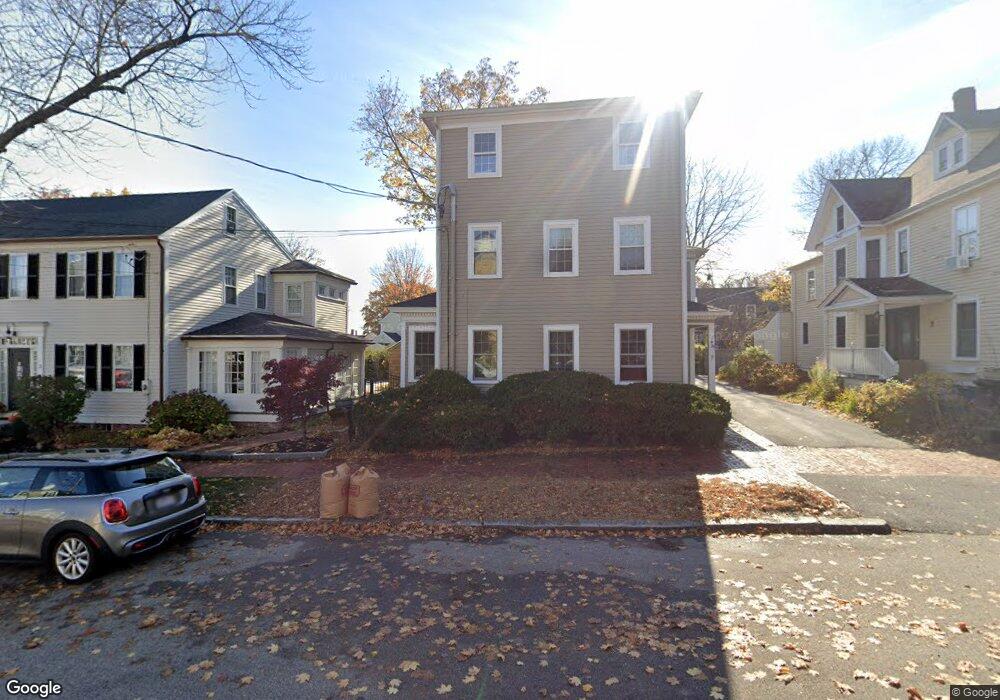
7 Broad St Unit 3 Newburyport, MA 01950
Estimated Value: $462,000 - $638,000
2
Beds
1
Bath
892
Sq Ft
$605/Sq Ft
Est. Value
About This Home
This home is located at 7 Broad St Unit 3, Newburyport, MA 01950 and is currently estimated at $539,920, approximately $605 per square foot. 7 Broad St Unit 3 is a home located in Essex County with nearby schools including Francis T. Bresnahan Elementary School, Edward G. Molin Elementary School, and Rupert A. Nock Middle School.
Ownership History
Date
Name
Owned For
Owner Type
Purchase Details
Closed on
Aug 17, 2021
Sold by
Cassin Brain K and Cassin Joan M
Bought by
Cassin Rt
Current Estimated Value
Purchase Details
Closed on
Sep 15, 2020
Sold by
Mclaughlin Susan J
Bought by
Cassin Brian K and Cassin Joan M
Home Financials for this Owner
Home Financials are based on the most recent Mortgage that was taken out on this home.
Original Mortgage
$276,250
Interest Rate
2.8%
Mortgage Type
New Conventional
Purchase Details
Closed on
Oct 31, 2003
Sold by
Gregory Susan and Shaw Susan
Bought by
Mclaughlin Susan J
Home Financials for this Owner
Home Financials are based on the most recent Mortgage that was taken out on this home.
Original Mortgage
$196,000
Interest Rate
6.05%
Mortgage Type
Purchase Money Mortgage
Purchase Details
Closed on
Apr 26, 2000
Sold by
Welle John and Gossett-Welle Kymm
Bought by
Gregory Susan
Purchase Details
Closed on
Mar 29, 1996
Sold by
Russo Joan
Bought by
Gossett Joe and Gossett Patricia
Create a Home Valuation Report for This Property
The Home Valuation Report is an in-depth analysis detailing your home's value as well as a comparison with similar homes in the area
Home Values in the Area
Average Home Value in this Area
Purchase History
| Date | Buyer | Sale Price | Title Company |
|---|---|---|---|
| Cassin Rt | -- | None Available | |
| Cassin Brian K | $325,000 | None Available | |
| Mclaughlin Susan J | $245,000 | -- | |
| Gregory Susan | $172,000 | -- | |
| Gossett Joe | $113,250 | -- |
Source: Public Records
Mortgage History
| Date | Status | Borrower | Loan Amount |
|---|---|---|---|
| Previous Owner | Cassin Brian K | $276,250 | |
| Previous Owner | Gossett Joe | $47,800 | |
| Previous Owner | Gossett Joe | $196,000 | |
| Previous Owner | Gossett Joe | $137,000 | |
| Previous Owner | Gossett Joe | $140,000 |
Source: Public Records
Tax History Compared to Growth
Tax History
| Year | Tax Paid | Tax Assessment Tax Assessment Total Assessment is a certain percentage of the fair market value that is determined by local assessors to be the total taxable value of land and additions on the property. | Land | Improvement |
|---|---|---|---|---|
| 2025 | $4,541 | $474,000 | $0 | $474,000 |
| 2024 | $4,430 | $444,300 | $0 | $444,300 |
| 2023 | $4,066 | $378,600 | $0 | $378,600 |
| 2022 | $3,965 | $330,100 | $0 | $330,100 |
| 2021 | $4,064 | $321,500 | $0 | $321,500 |
| 2020 | $4,046 | $315,100 | $0 | $315,100 |
| 2019 | $3,903 | $298,400 | $0 | $298,400 |
| 2018 | $3,837 | $289,400 | $0 | $289,400 |
| 2017 | $3,720 | $276,600 | $0 | $276,600 |
| 2016 | $3,496 | $261,100 | $0 | $261,100 |
| 2015 | $3,015 | $226,000 | $0 | $226,000 |
Source: Public Records
Map
Nearby Homes
- 13 Broad St
- 217 Merrimac St Unit 1
- 27 Warren St Unit 1
- 266 Merrimac St Unit F
- 288 Merrimac St
- 158 Merrimac St Unit 3
- 126 Merrimac St Unit 35
- 126 Merrimac St Unit 31
- 45 Boardman St Unit 1
- 44 Washington St Unit C
- 41 Washington St Unit B
- 14 Dexter Ln Unit B
- 14 Dexter Ln Unit A
- 287 1/2 High St
- 58 Merrimac St Unit 2-5
- 2 Court St Unit 4
- 175 Bridge Rd
- 110 Low St
- 138 Low St
- 10 10th St
- 7 Broad St Unit 4
- 7 Broad St Unit 2
- 7 Broad St Unit 1
- 7 Broad St
- 11 Broad St
- 9 Broad St
- 3 Broad St
- 8 Carter St
- 1 Broad St
- 1 Broad St Unit 1
- 16 Carter St
- 16 Carter St Unit 16
- 16 Carter St Unit 1
- 6 Carter St
- 14 Carter St
- 15 Broad St
- 219 Merrimac St Unit 221
- 4 Carter St
- 225 Merrimac St Unit 227
- 223 Merrimac St