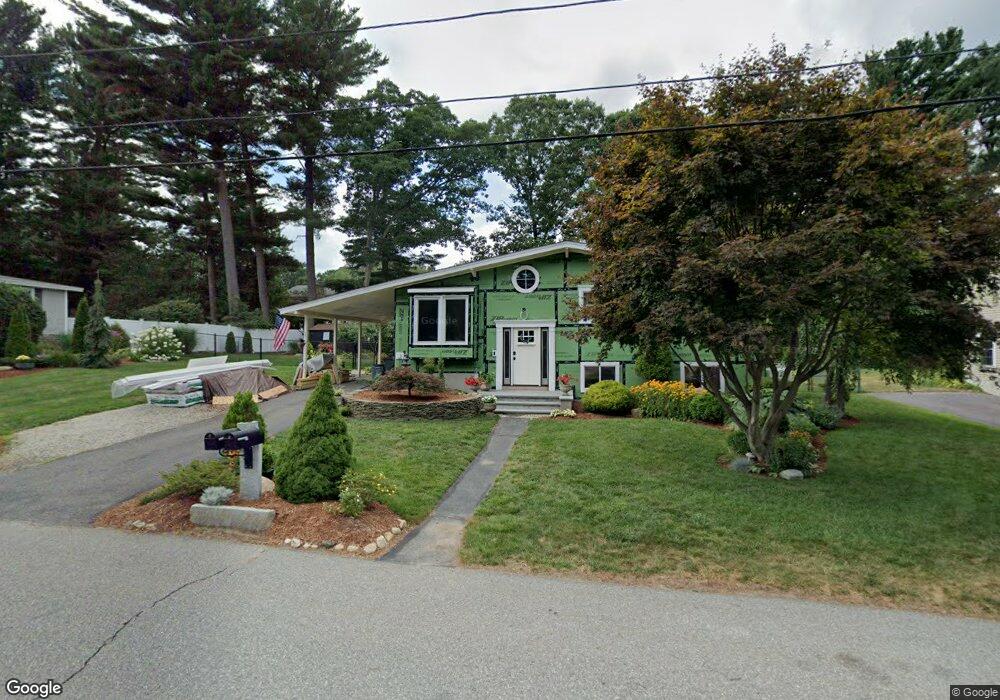
7 Bryden Rd Southborough, MA 01772
Estimated Value: $583,032 - $652,000
3
Beds
2
Baths
1,400
Sq Ft
$438/Sq Ft
Est. Value
About This Home
This home is located at 7 Bryden Rd, Southborough, MA 01772 and is currently estimated at $612,758, approximately $437 per square foot. 7 Bryden Rd is a home located in Worcester County with nearby schools including Albert S. Woodward Memorial School, Margaret A. Neary School, and P. Brent Trottier Middle School.
Ownership History
Date
Name
Owned For
Owner Type
Purchase Details
Closed on
May 2, 2013
Sold by
Yu Lei and Zhang Ning
Bought by
Parks Jonathan C
Current Estimated Value
Home Financials for this Owner
Home Financials are based on the most recent Mortgage that was taken out on this home.
Original Mortgage
$306,347
Outstanding Balance
$216,474
Interest Rate
3.57%
Mortgage Type
New Conventional
Estimated Equity
$396,284
Purchase Details
Closed on
Jul 1, 2003
Sold by
Lawrence Leslie Z
Bought by
Yu Lie and Zhang Ning
Create a Home Valuation Report for This Property
The Home Valuation Report is an in-depth analysis detailing your home's value as well as a comparison with similar homes in the area
Home Values in the Area
Average Home Value in this Area
Purchase History
| Date | Buyer | Sale Price | Title Company |
|---|---|---|---|
| Parks Jonathan C | $299,900 | -- | |
| Parks Jonathan C | $299,900 | -- | |
| Yu Lie | $298,000 | -- | |
| Yu Lie | $298,000 | -- |
Source: Public Records
Mortgage History
| Date | Status | Borrower | Loan Amount |
|---|---|---|---|
| Open | Parks Jonathan C | $306,347 | |
| Closed | Parks Jonathan C | $306,347 | |
| Previous Owner | Yu Lie | $206,000 |
Source: Public Records
Tax History Compared to Growth
Tax History
| Year | Tax Paid | Tax Assessment Tax Assessment Total Assessment is a certain percentage of the fair market value that is determined by local assessors to be the total taxable value of land and additions on the property. | Land | Improvement |
|---|---|---|---|---|
| 2025 | $6,609 | $478,600 | $276,600 | $202,000 |
| 2024 | $6,618 | $475,800 | $276,600 | $199,200 |
| 2023 | $6,624 | $448,800 | $264,900 | $183,900 |
| 2022 | $6,527 | $400,900 | $230,400 | $170,500 |
| 2021 | $5,860 | $361,500 | $212,000 | $149,500 |
| 2020 | $5,889 | $353,500 | $200,400 | $153,100 |
| 2019 | $12,049 | $341,500 | $195,700 | $145,800 |
| 2018 | $5,207 | $322,600 | $189,400 | $133,200 |
| 2017 | $2,931 | $312,500 | $189,400 | $123,100 |
| 2016 | $4,673 | $295,400 | $184,100 | $111,300 |
| 2015 | $4,537 | $283,200 | $170,500 | $112,700 |
Source: Public Records
Map
Nearby Homes
- 8 Parker St
- 20 Southville Rd
- 3 Candlewood Ln
- 262 Parkerville Rd
- 19 Gilmore Rd
- 35 Lincoln St
- 37 Lincoln St
- 2 Aikens Rd
- 2 Fairview Dr
- 23 Stonebrook Ct Unit 11
- 54 Gilmore Rd
- 17 Highcroft Way
- 9 Highcroft Way Unit 9
- 12 Highcroft Way
- 11 Skylar Dr
- 43 Edgewood Rd
- 8 Lorenzo Dr
- 9 John Matthews Rd
- 22 Irene Cir
- 20 Clifford Rd