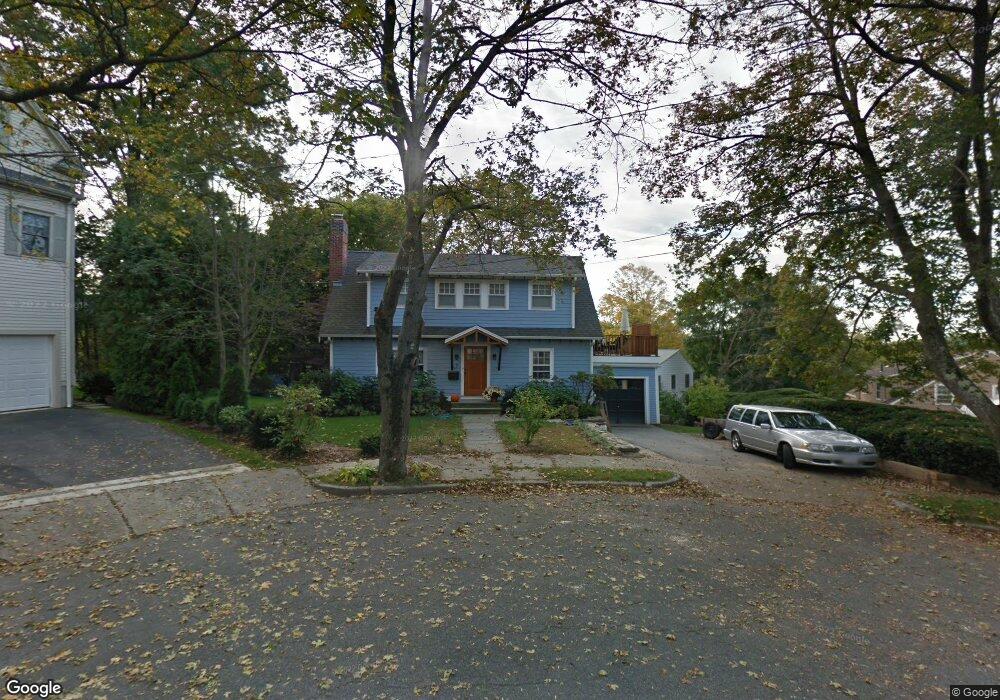
7 Bunny Cir Newton, MA 02458
Newton Corner NeighborhoodEstimated Value: $1,450,942 - $1,964,000
3
Beds
3
Baths
2,462
Sq Ft
$680/Sq Ft
Est. Value
About This Home
This home is located at 7 Bunny Cir, Newton, MA 02458 and is currently estimated at $1,673,236, approximately $679 per square foot. 7 Bunny Cir is a home located in Middlesex County with nearby schools including Cabot Elementary School, F.A. Day Middle School, and Newton North High School.
Ownership History
Date
Name
Owned For
Owner Type
Purchase Details
Closed on
Mar 4, 2024
Sold by
Geffen Mark D and Delaney Erin L
Bought by
Mark D Geffen Ret and Geffen
Current Estimated Value
Purchase Details
Closed on
Oct 18, 2006
Sold by
Orzack Louis H
Bought by
Delaney Erin L and Geffen Mark D
Home Financials for this Owner
Home Financials are based on the most recent Mortgage that was taken out on this home.
Original Mortgage
$375,000
Interest Rate
6.49%
Mortgage Type
Purchase Money Mortgage
Create a Home Valuation Report for This Property
The Home Valuation Report is an in-depth analysis detailing your home's value as well as a comparison with similar homes in the area
Home Values in the Area
Average Home Value in this Area
Purchase History
| Date | Buyer | Sale Price | Title Company |
|---|---|---|---|
| Mark D Geffen Ret | -- | None Available | |
| Delaney Erin L | $475,000 | -- |
Source: Public Records
Mortgage History
| Date | Status | Borrower | Loan Amount |
|---|---|---|---|
| Previous Owner | Delaney Erin L | $375,000 |
Source: Public Records
Tax History
| Year | Tax Paid | Tax Assessment Tax Assessment Total Assessment is a certain percentage of the fair market value that is determined by local assessors to be the total taxable value of land and additions on the property. | Land | Improvement |
|---|---|---|---|---|
| 2025 | $12,165 | $1,241,300 | $1,044,500 | $196,800 |
| 2024 | $11,762 | $1,205,100 | $1,014,100 | $191,000 |
| 2023 | $11,124 | $1,092,700 | $777,900 | $314,800 |
| 2022 | $10,644 | $1,011,800 | $720,300 | $291,500 |
| 2021 | $10,270 | $954,500 | $679,500 | $275,000 |
| 2020 | $9,965 | $954,500 | $679,500 | $275,000 |
| 2019 | $9,684 | $926,700 | $659,700 | $267,000 |
| 2018 | $9,290 | $858,600 | $595,900 | $262,700 |
| 2017 | $9,007 | $810,000 | $562,200 | $247,800 |
| 2016 | $8,615 | $757,000 | $525,400 | $231,600 |
| 2015 | $8,214 | $707,500 | $491,000 | $216,500 |
Source: Public Records
Map
Nearby Homes
- 0 Claremont St
- 84 E Side Pkwy Unit 84
- 216 Newtonville Ave Unit 218
- 35 George St Unit 35
- 37 George St Unit 37
- 33 George St Unit 33
- 549 Centre St Unit 2
- 59 Hyde Ave
- 327 Franklin St
- 47 Blake St Unit 47
- 97 Eldredge St
- 48 Harvard St Unit 1
- 123 Sargent St
- 129 Withington Rd Unit 129
- 10 Washington Park Unit 2
- 10 Washington Park Unit 1
- 269 Franklin St
- 298 Cabot St Unit 298
- 300 Cabot St
- 34 Channing St Unit 2
Your Personal Tour Guide
Ask me questions while you tour the home.