Estimated Value: $331,000 - $349,000
4
Beds
3
Baths
2,242
Sq Ft
$152/Sq Ft
Est. Value
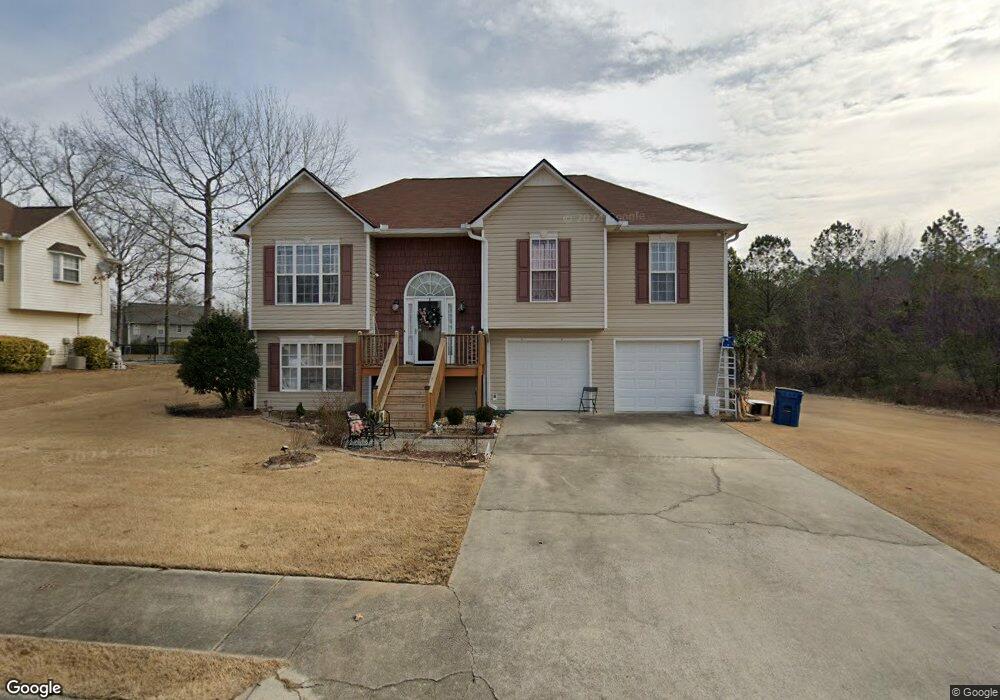
About This Home
This home is located at 7 Butternut Ln NE, Rome, GA 30165 and is currently estimated at $340,495, approximately $151 per square foot. 7 Butternut Ln NE is a home located in Floyd County with nearby schools including Armuchee Middle School and Armuchee High School.
Ownership History
Date
Name
Owned For
Owner Type
Purchase Details
Closed on
Oct 24, 2017
Sold by
Magnicheri Lori
Bought by
Zhang Shanzhu Chen and Zhang Chunshu
Current Estimated Value
Home Financials for this Owner
Home Financials are based on the most recent Mortgage that was taken out on this home.
Original Mortgage
$134,400
Outstanding Balance
$73,059
Interest Rate
3.83%
Mortgage Type
New Conventional
Estimated Equity
$267,436
Purchase Details
Closed on
Jun 21, 2012
Bought by
P and R
Purchase Details
Closed on
May 28, 2010
Sold by
Becker Dean J
Bought by
Magnicheri Lori
Home Financials for this Owner
Home Financials are based on the most recent Mortgage that was taken out on this home.
Original Mortgage
$148,200
Interest Rate
5%
Mortgage Type
New Conventional
Purchase Details
Closed on
Sep 15, 2000
Sold by
Hackett Tom Builder & Developer Inc
Bought by
Becker Dean J and Becker Michelle E
Purchase Details
Closed on
May 31, 2000
Sold by
Birchfield Inc
Bought by
Hackett Tom Builder & Developer Inc
Purchase Details
Closed on
Oct 17, 1996
Bought by
Birchfield Inc
Create a Home Valuation Report for This Property
The Home Valuation Report is an in-depth analysis detailing your home's value as well as a comparison with similar homes in the area
Home Values in the Area
Average Home Value in this Area
Purchase History
| Date | Buyer | Sale Price | Title Company |
|---|---|---|---|
| Zhang Shanzhu Chen | $168,000 | -- | |
| P | -- | -- | |
| Magnicheri Lori | $156,000 | -- | |
| Becker Dean J | $138,000 | -- | |
| Hackett Tom Builder & Developer Inc | $15,500 | -- | |
| Birchfield Inc | -- | -- |
Source: Public Records
Mortgage History
| Date | Status | Borrower | Loan Amount |
|---|---|---|---|
| Open | Zhang Shanzhu Chen | $134,400 | |
| Previous Owner | Magnicheri Lori | $148,200 |
Source: Public Records
Tax History Compared to Growth
Tax History
| Year | Tax Paid | Tax Assessment Tax Assessment Total Assessment is a certain percentage of the fair market value that is determined by local assessors to be the total taxable value of land and additions on the property. | Land | Improvement |
|---|---|---|---|---|
| 2024 | $4,198 | $135,009 | $9,660 | $125,349 |
| 2023 | $3,927 | $131,424 | $9,660 | $121,764 |
| 2022 | $3,362 | $111,128 | $9,200 | $101,928 |
| 2021 | $2,679 | $86,659 | $9,200 | $77,459 |
| 2020 | $2,551 | $81,832 | $9,200 | $72,632 |
| 2019 | $2,380 | $77,364 | $9,200 | $68,164 |
| 2018 | $2,076 | $69,640 | $9,200 | $60,440 |
| 2017 | $1,828 | $62,030 | $9,200 | $52,830 |
| 2016 | $1,826 | $61,200 | $9,200 | $52,000 |
| 2015 | -- | $60,787 | $9,200 | $51,587 |
| 2014 | -- | $60,787 | $9,200 | $51,587 |
Source: Public Records
Map
Nearby Homes
- 20 Pippin Place NE
- 42 Pippin Place NE
- 27 Boxwood Ln NE
- 12 Applewood Dr NE
- 1 Wynnie Rd NE
- 263 E Big Indian Trail NE
- 264 E Big Indian Trail NE
- 3 Harbour Rd NE
- 0 Scott Dr NE
- 65 Tency Ln NE
- 31 Tency Ln NE
- 11 Don Dr NE
- 20 Collier Rd NE
- 23 Whistling Oaks Dr NE
- 25 Majestic Oaks Way NE
- 8 Mossy Oaks Ln NE
- 9 Royal Oak Dr NE
- 12 Majestic Oaks Way NE
- 16 Sproull St NE
- 17 Royal Oak Dr NE
- 5 Butternut Ln NE Unit 1951
- 5 Butternut Ln NE
- 14 Butternut Ln NE
- 12 Butternut Ln NE
- 11 Butternut Ln NE
- 10 Butternut Ln NE
- 3 Butternut Ln NE
- 26 Birchfield Dr NE
- 24 Birchfield Dr NE
- 0 Butternut Ln Unit 7009992
- 0 Butternut Ln Unit 8641865
- 0 Butternut Ln Unit 8259694
- 0 Butternut Ln Unit 3154436
- 0 Butternut Ln Unit 3229560
- 0 Butternut Ln Unit 9004262
- 0 Butternut Ln
- 28 Birchfield Dr NE
- 8 Butternut Ln NE
- 22 Birchfield Dr NE
- 13 Butternut Ln NE