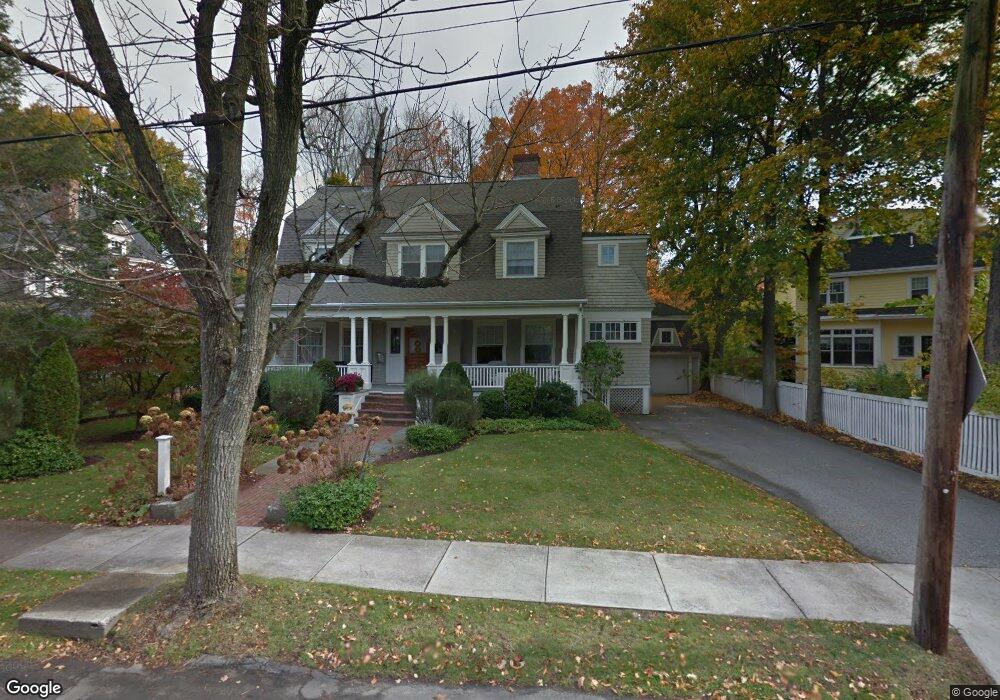
7 Cabot St Winchester, MA 01890
The Flats NeighborhoodEstimated Value: $2,004,000 - $3,000,000
4
Beds
4
Baths
4,476
Sq Ft
$581/Sq Ft
Est. Value
About This Home
This home is located at 7 Cabot St, Winchester, MA 01890 and is currently estimated at $2,601,604, approximately $581 per square foot. 7 Cabot St is a home located in Middlesex County with nearby schools including Lynch Elementary School, McCall Middle School, and Winchester High School.
Ownership History
Date
Name
Owned For
Owner Type
Purchase Details
Closed on
Nov 20, 2017
Sold by
Manko Clifford M and Manko Patricia K
Bought by
Clifford M Manko T
Current Estimated Value
Purchase Details
Closed on
Nov 30, 1995
Sold by
Daw Rt
Bought by
Manko Clifford M and Manko Patricia K
Home Financials for this Owner
Home Financials are based on the most recent Mortgage that was taken out on this home.
Original Mortgage
$280,000
Interest Rate
7.37%
Mortgage Type
Purchase Money Mortgage
Create a Home Valuation Report for This Property
The Home Valuation Report is an in-depth analysis detailing your home's value as well as a comparison with similar homes in the area
Home Values in the Area
Average Home Value in this Area
Purchase History
| Date | Buyer | Sale Price | Title Company |
|---|---|---|---|
| Clifford M Manko T | -- | -- | |
| Manko Clifford M | $350,000 | -- |
Source: Public Records
Mortgage History
| Date | Status | Borrower | Loan Amount |
|---|---|---|---|
| Previous Owner | Manko Clifford M | $280,000 |
Source: Public Records
Tax History Compared to Growth
Tax History
| Year | Tax Paid | Tax Assessment Tax Assessment Total Assessment is a certain percentage of the fair market value that is determined by local assessors to be the total taxable value of land and additions on the property. | Land | Improvement |
|---|---|---|---|---|
| 2025 | $237 | $2,139,700 | $1,080,900 | $1,058,800 |
| 2024 | $23,338 | $2,059,800 | $1,049,200 | $1,010,600 |
| 2023 | $21,920 | $1,857,600 | $985,600 | $872,000 |
| 2022 | $21,522 | $1,720,400 | $890,200 | $830,200 |
| 2021 | $20,645 | $1,609,100 | $778,900 | $830,200 |
| 2020 | $0 | $1,562,300 | $778,900 | $783,400 |
| 2019 | $17,764 | $1,466,900 | $683,500 | $783,400 |
| 2018 | $11,032 | $1,431,400 | $667,600 | $763,800 |
| 2017 | $0 | $1,371,500 | $635,100 | $736,400 |
| 2016 | $15,649 | $1,339,800 | $635,100 | $704,700 |
| 2015 | $15,370 | $1,266,100 | $577,000 | $689,100 |
| 2014 | $15,367 | $1,213,800 | $524,600 | $689,200 |
Source: Public Records
Map
Nearby Homes
- 1 Copley St
- 104 Church St
- 6 Wyman Ct Unit 6
- 4 Wyman Ct Unit 4
- 15 Wildwood St
- 10 Sheffield Rd
- 44 Cabot St
- 6 Ivy Cir
- 19 Glengarry Rd
- 2 Everett Ave
- 89 Wildwood St
- 46 Church St
- 53 Bacon St
- 32 Woodside Rd
- 9 Lakeview Terrace
- 36 Elmwood Ave Unit 2
- 666 Main St Unit 312
- 9 Norfolk Rd
- 62 Richardson St
- 149 Horn Pond Brook Rd