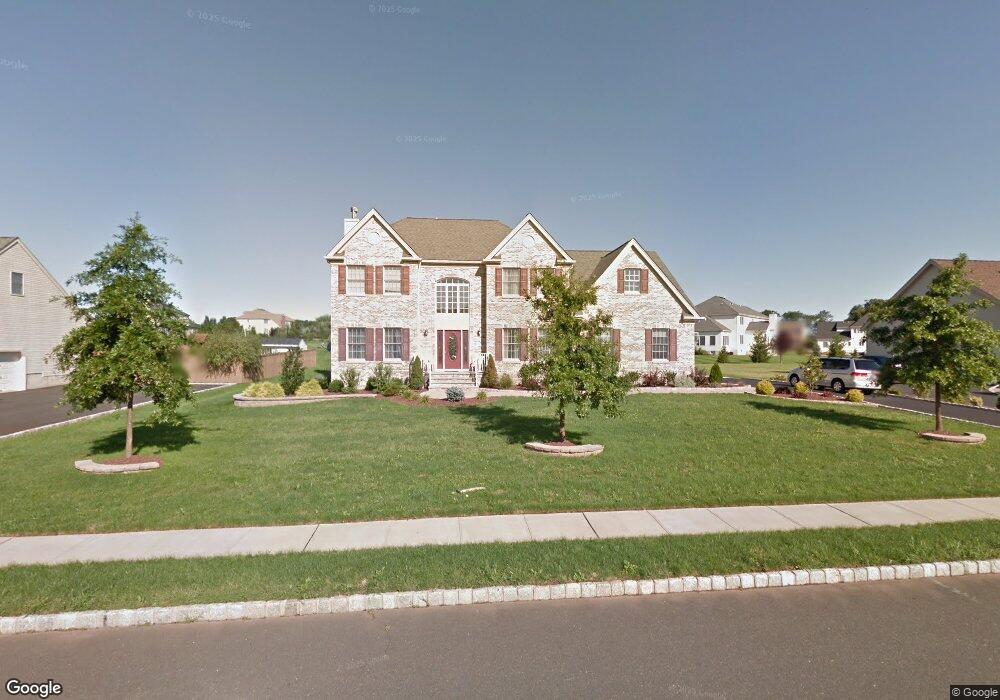
7 Cain Dr Hillsborough, NJ 08844
Estimated Value: $1,123,000 - $1,203,639
--
Bed
--
Bath
3,141
Sq Ft
$370/Sq Ft
Est. Value
About This Home
This home is located at 7 Cain Dr, Hillsborough, NJ 08844 and is currently estimated at $1,160,910, approximately $369 per square foot. 7 Cain Dr is a home located in Somerset County with nearby schools including Hillsborough High School, Central Jersey College Prep Charter School, and Brighthorizons at Hillsborough.
Ownership History
Date
Name
Owned For
Owner Type
Purchase Details
Closed on
Feb 1, 2007
Sold by
Shah Nipa and Shah Nipa Prakashchandra
Bought by
Shah Paresh Thakorlal
Current Estimated Value
Purchase Details
Closed on
Jan 26, 2006
Sold by
Country Classics Iii & Iv Llc
Bought by
Shah Paresh Thakorlal
Home Financials for this Owner
Home Financials are based on the most recent Mortgage that was taken out on this home.
Original Mortgage
$359,000
Outstanding Balance
$203,417
Interest Rate
6.31%
Estimated Equity
$957,493
Create a Home Valuation Report for This Property
The Home Valuation Report is an in-depth analysis detailing your home's value as well as a comparison with similar homes in the area
Home Values in the Area
Average Home Value in this Area
Purchase History
| Date | Buyer | Sale Price | Title Company |
|---|---|---|---|
| Shah Paresh Thakorlal | -- | Lawyers Title Insurance Co | |
| Shah Paresh Thakorlal | $642,057 | -- |
Source: Public Records
Mortgage History
| Date | Status | Borrower | Loan Amount |
|---|---|---|---|
| Open | Shah Paresh Thakorlal | $359,000 |
Source: Public Records
Tax History Compared to Growth
Tax History
| Year | Tax Paid | Tax Assessment Tax Assessment Total Assessment is a certain percentage of the fair market value that is determined by local assessors to be the total taxable value of land and additions on the property. | Land | Improvement |
|---|---|---|---|---|
| 2025 | $19,150 | $976,900 | $455,300 | $521,600 |
| 2024 | $19,150 | $893,600 | $405,300 | $488,300 |
| 2023 | $17,553 | $815,300 | $365,300 | $450,000 |
| 2022 | $17,455 | $781,700 | $370,300 | $411,400 |
| 2021 | $16,441 | $700,200 | $290,300 | $409,900 |
| 2020 | $16,149 | $677,400 | $265,300 | $412,100 |
| 2019 | $16,097 | $669,600 | $255,300 | $414,300 |
| 2018 | $16,265 | $672,400 | $250,300 | $422,100 |
| 2017 | $15,355 | $635,800 | $260,700 | $375,100 |
| 2016 | $15,396 | $637,800 | $260,700 | $377,100 |
| 2015 | $15,236 | $612,800 | $250,700 | $362,100 |
| 2014 | $14,347 | $614,700 | $250,700 | $364,000 |
Source: Public Records
Map
Nearby Homes