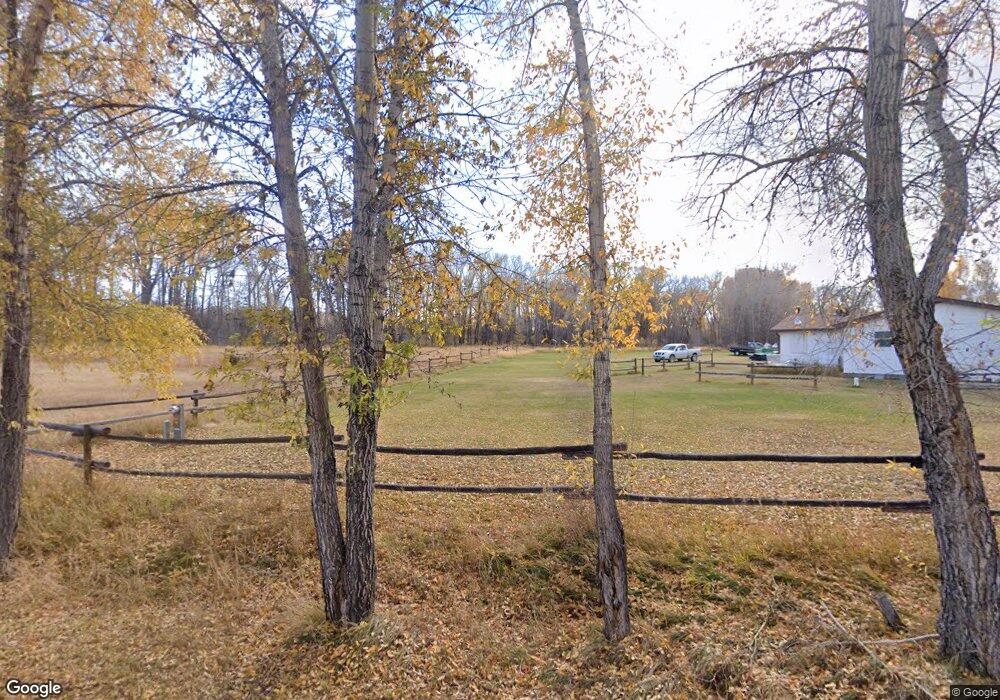
7 Cedar Dr Encampment, WY 82325
Estimated Value: $279,000 - $560,000
--
Bed
--
Bath
2,278
Sq Ft
$204/Sq Ft
Est. Value
About This Home
This home is located at 7 Cedar Dr, Encampment, WY 82325 and is currently estimated at $465,678, approximately $204 per square foot. 7 Cedar Dr is a home.
Ownership History
Date
Name
Owned For
Owner Type
Purchase Details
Closed on
Mar 4, 2009
Sold by
Stoker Marvin J and Stoker Betsey C
Bought by
Smith John A and Smith Phyllis J
Current Estimated Value
Create a Home Valuation Report for This Property
The Home Valuation Report is an in-depth analysis detailing your home's value as well as a comparison with similar homes in the area
Home Values in the Area
Average Home Value in this Area
Purchase History
| Date | Buyer | Sale Price | Title Company |
|---|---|---|---|
| Smith John A | -- | None Available |
Source: Public Records
Tax History Compared to Growth
Tax History
| Year | Tax Paid | Tax Assessment Tax Assessment Total Assessment is a certain percentage of the fair market value that is determined by local assessors to be the total taxable value of land and additions on the property. | Land | Improvement |
|---|---|---|---|---|
| 2025 | $2,984 | $34,599 | $5,872 | $28,727 |
| 2024 | $2,984 | $48,518 | $7,929 | $40,589 |
| 2023 | $2,984 | $48,520 | $7,582 | $40,938 |
| 2022 | $1,980 | $33,854 | $2,000 | $31,854 |
| 2021 | $1,980 | $31,235 | $2,000 | $29,235 |
| 2020 | $1,825 | $93,615 | $6,000 | $87,615 |
| 2019 | $1,802 | $30,802 | $2,173 | $28,629 |
| 2018 | $1,690 | $28,892 | $2,173 | $26,719 |
| 2017 | $1,734 | $29,643 | $2,434 | $27,209 |
| 2016 | $1,693 | $28,948 | $2,339 | $26,609 |
| 2015 | -- | $30,330 | $3,444 | $26,886 |
| 2014 | -- | $29,699 | $3,827 | $25,872 |
Source: Public Records
Map
Nearby Homes
- 29 Cedar Dr
- 36 County Road 211
- 0 Block 67 Unit 20241836
- 61 Blackhall E
- 0 Jackson Ave
- 621 Freeman Ave
- 303-311 Macfarlane Ave
- Lot 118 & 120 Townsite at Battle Creek
- 31 Stockdrive Trail
- Acreage Wy 70
- 29 Sierra Madre Rd
- 5 Plattoga
- MS208 Highway 70
- 32 A Forest Service
- 0 County Road 504 Unit 20245825
- 105 Elk Dr
- 301 Cutthroat
- 302 Cutthroat
- 303 Cutthroat
- 401 Tiger Trout
- 1 Cedar Dr
- 6 Cedar Dr
- 1 Spruce Ct
- 19 County Road 648
- 3 County Road 648
- 4 Spruce Ct
- 6 County Road 648
- 3 Spruce Ct
- 14 County Road 648
- 18 County Road 648
- 2 County Road 648 Unit Cherokee Meadows
- 22 County Road 648
- 6 Willow Ct
- 29 County Road 648
- 10070 State Highway 230
- 10076 State Highway 230
- 1057C State Highway 230
- 11097 State Highway 230
- 27 Cedar Dr
- Lot 29 SE Cedar