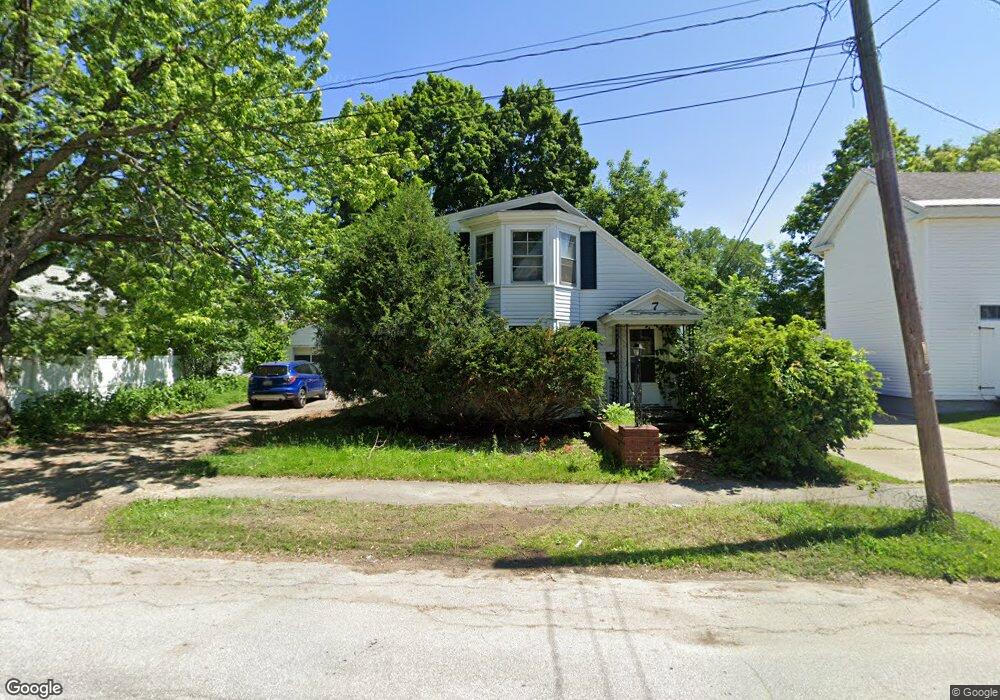
7 Cedar St Brewer, ME 04412
Estimated Value: $256,000 - $269,000
3
Beds
1
Bath
1,936
Sq Ft
$136/Sq Ft
Est. Value
About This Home
This home is located at 7 Cedar St, Brewer, ME 04412 and is currently estimated at $263,330, approximately $136 per square foot. 7 Cedar St is a home located in Penobscot County with nearby schools including Brewer Community School, Brewer High School, and All Saints Catholic School St. Mary's campus PreK-3.
Ownership History
Date
Name
Owned For
Owner Type
Purchase Details
Closed on
Apr 28, 2008
Sold by
Piper Janis L
Bought by
Poole Kimberly B
Current Estimated Value
Home Financials for this Owner
Home Financials are based on the most recent Mortgage that was taken out on this home.
Original Mortgage
$134,391
Interest Rate
6.22%
Mortgage Type
FHA
Create a Home Valuation Report for This Property
The Home Valuation Report is an in-depth analysis detailing your home's value as well as a comparison with similar homes in the area
Home Values in the Area
Average Home Value in this Area
Purchase History
| Date | Buyer | Sale Price | Title Company |
|---|---|---|---|
| Poole Kimberly B | -- | -- | |
| Poole Kimberly B | -- | -- |
Source: Public Records
Mortgage History
| Date | Status | Borrower | Loan Amount |
|---|---|---|---|
| Open | Poole Kimberly B | $138,902 | |
| Closed | Poole Kimberly B | $134,391 |
Source: Public Records
Tax History
| Year | Tax Paid | Tax Assessment Tax Assessment Total Assessment is a certain percentage of the fair market value that is determined by local assessors to be the total taxable value of land and additions on the property. | Land | Improvement |
|---|---|---|---|---|
| 2025 | $3,448 | $223,900 | $23,000 | $200,900 |
| 2024 | $3,459 | $184,000 | $23,000 | $161,000 |
| 2023 | $3,319 | $165,100 | $21,200 | $143,900 |
| 2021 | $3,091 | $138,600 | $21,100 | $117,500 |
| 2020 | $3,153 | $138,600 | $21,100 | $117,500 |
| 2019 | $3,186 | $138,600 | $21,100 | $117,500 |
| 2018 | $2,729 | $121,300 | $21,100 | $100,200 |
| 2017 | $2,729 | $121,300 | $21,100 | $100,200 |
| 2016 | $2,610 | $121,300 | $21,100 | $100,200 |
| 2015 | $2,610 | $121,300 | $21,100 | $100,200 |
| 2014 | $2,538 | $121,300 | $21,100 | $100,200 |
| 2013 | $2,929 | $140,000 | $10,300 | $129,700 |
Source: Public Records
Map
Nearby Homes
Your Personal Tour Guide
Ask me questions while you tour the home.