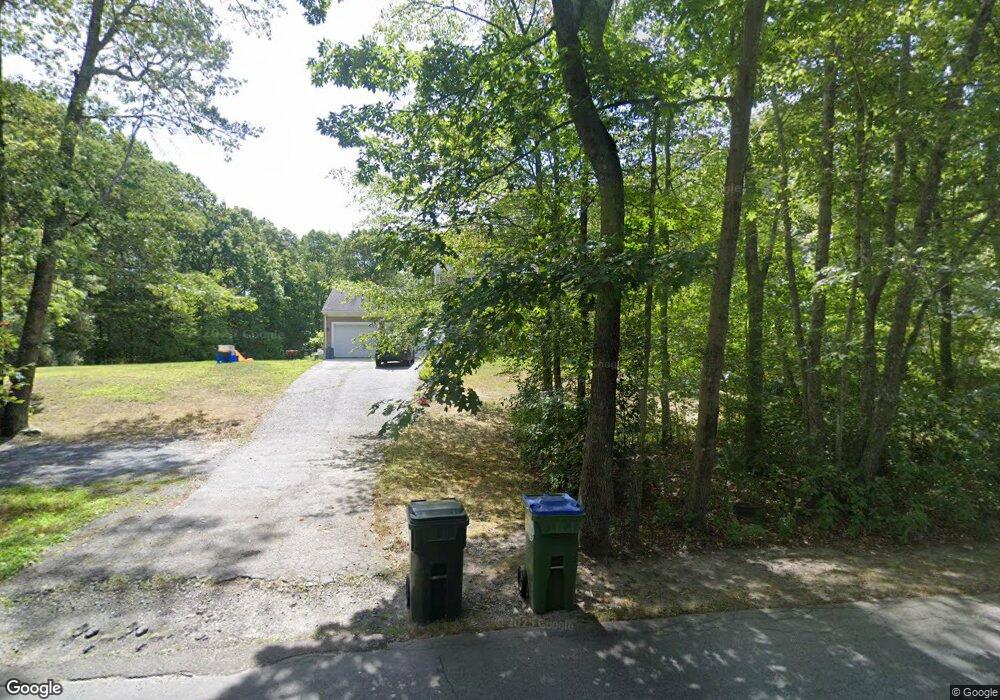
7 Cedar St Rehoboth, MA 02769
Estimated Value: $631,032 - $759,000
3
Beds
3
Baths
1,664
Sq Ft
$413/Sq Ft
Est. Value
About This Home
This home is located at 7 Cedar St, Rehoboth, MA 02769 and is currently estimated at $686,758, approximately $412 per square foot. 7 Cedar St is a home located in Bristol County with nearby schools including Dighton-Rehoboth Regional High School.
Ownership History
Date
Name
Owned For
Owner Type
Purchase Details
Closed on
Jan 8, 2016
Sold by
Lane Bradford S and Lane Lois M
Bought by
Miller Angela C
Current Estimated Value
Home Financials for this Owner
Home Financials are based on the most recent Mortgage that was taken out on this home.
Original Mortgage
$302,000
Outstanding Balance
$240,187
Interest Rate
3.96%
Mortgage Type
New Conventional
Estimated Equity
$446,571
Purchase Details
Closed on
Jun 2, 2000
Sold by
Fisk Mitchel O and Lussier Richard P
Bought by
Lane Bradford S and Lane Lois M
Home Financials for this Owner
Home Financials are based on the most recent Mortgage that was taken out on this home.
Original Mortgage
$183,800
Interest Rate
8.14%
Mortgage Type
Purchase Money Mortgage
Create a Home Valuation Report for This Property
The Home Valuation Report is an in-depth analysis detailing your home's value as well as a comparison with similar homes in the area
Home Values in the Area
Average Home Value in this Area
Purchase History
| Date | Buyer | Sale Price | Title Company |
|---|---|---|---|
| Miller Angela C | $342,000 | -- | |
| Lane Bradford S | $198,900 | -- |
Source: Public Records
Mortgage History
| Date | Status | Borrower | Loan Amount |
|---|---|---|---|
| Open | Miller Angela C | $302,000 | |
| Previous Owner | Lane Bradford S | $30,000 | |
| Previous Owner | Lane Bradford S | $186,500 | |
| Previous Owner | Lane Bradford S | $183,800 | |
| Previous Owner | Lane Bradford S | $30,000 |
Source: Public Records
Tax History
| Year | Tax Paid | Tax Assessment Tax Assessment Total Assessment is a certain percentage of the fair market value that is determined by local assessors to be the total taxable value of land and additions on the property. | Land | Improvement |
|---|---|---|---|---|
| 2025 | $57 | $512,800 | $174,700 | $338,100 |
| 2024 | $5,185 | $456,400 | $174,700 | $281,700 |
| 2023 | $4,916 | $424,500 | $171,100 | $253,400 |
| 2022 | $4,882 | $385,300 | $171,100 | $214,200 |
| 2021 | $4,768 | $360,100 | $163,300 | $196,800 |
| 2020 | $4,725 | $360,100 | $163,300 | $196,800 |
| 2018 | $1,381 | $339,000 | $155,500 | $183,500 |
| 2017 | $3,978 | $316,700 | $155,500 | $161,200 |
| 2016 | $3,848 | $316,700 | $155,500 | $161,200 |
| 2015 | $3,714 | $301,700 | $148,300 | $153,400 |
| 2014 | $3,664 | $294,500 | $141,100 | $153,400 |
Source: Public Records
Map
Nearby Homes
- 19 Cedar St Unit 21
- 2188 Cedar St
- 2625 Lewis St
- 2713 Horton St
- 46 Mikayla Ann Dr
- 2206 Williams St
- 2681 Courtlyn Rd
- 0 Wellington St
- 185 Moulton St
- 0 Horton St Unit 73333337
- 42 Linden Ln
- 8 Linden Ln
- 8 Linden Ln
- 24 New St
- 74R Club House Dr Unit 74R
- 73H Club House Dr Unit Lot 73H
- 35 Clubhouse Dr Unit RR35
- RR36 Club House Dr Unit Lot RR36
- RR33 Club House Dr Unit Lot RR33
- RR38 Club House Unit RR38
Your Personal Tour Guide
Ask me questions while you tour the home.