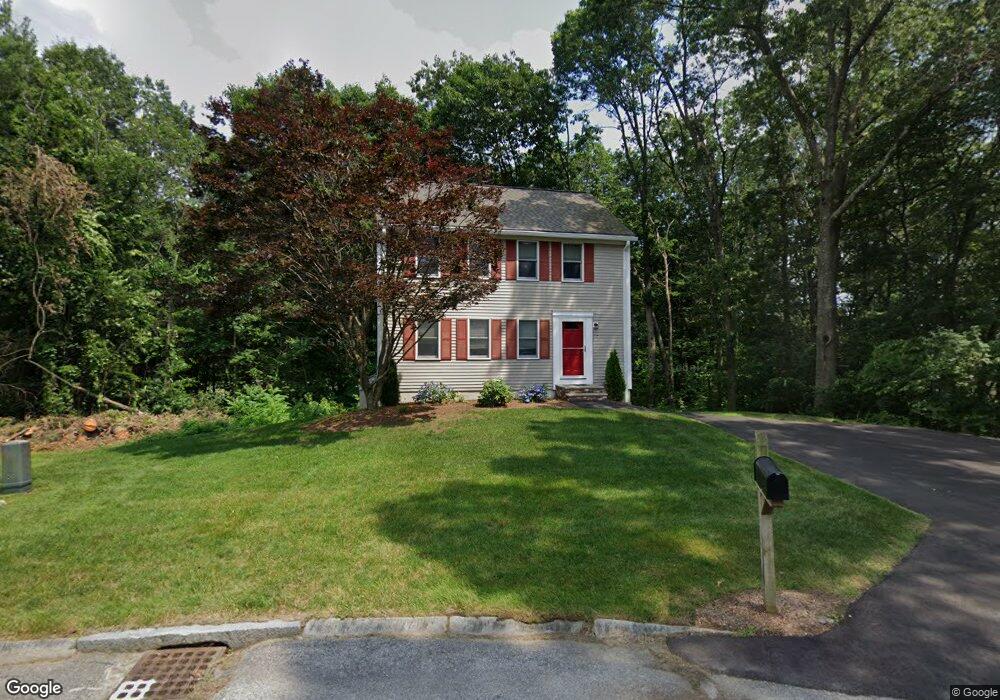
7 Celia Cir Methuen, MA 01844
The East End NeighborhoodEstimated Value: $597,860 - $622,000
3
Beds
2
Baths
1,372
Sq Ft
$445/Sq Ft
Est. Value
About This Home
This home is located at 7 Celia Cir, Methuen, MA 01844 and is currently estimated at $610,215, approximately $444 per square foot. 7 Celia Cir is a home located in Essex County with nearby schools including Timony Grammar School, Methuen High School, and Community Day Charter Public School - Gateway.
Ownership History
Date
Name
Owned For
Owner Type
Purchase Details
Closed on
Jun 2, 1998
Sold by
Madsen Michael A
Bought by
Keleher Edward F
Current Estimated Value
Home Financials for this Owner
Home Financials are based on the most recent Mortgage that was taken out on this home.
Original Mortgage
$110,000
Outstanding Balance
$22,140
Interest Rate
7.12%
Mortgage Type
Purchase Money Mortgage
Estimated Equity
$588,075
Purchase Details
Closed on
Oct 12, 1990
Sold by
Rainbow Bldrs Nt Ii
Bought by
Madsen Michael A
Create a Home Valuation Report for This Property
The Home Valuation Report is an in-depth analysis detailing your home's value as well as a comparison with similar homes in the area
Home Values in the Area
Average Home Value in this Area
Purchase History
| Date | Buyer | Sale Price | Title Company |
|---|---|---|---|
| Keleher Edward F | $158,100 | -- | |
| Keleher Edward F | $158,100 | -- | |
| Madsen Michael A | $151,000 | -- | |
| Madsen Michael A | $151,000 | -- |
Source: Public Records
Mortgage History
| Date | Status | Borrower | Loan Amount |
|---|---|---|---|
| Open | Madsen Michael A | $110,000 | |
| Closed | Madsen Michael A | $110,000 | |
| Previous Owner | Madsen Michael A | $151,500 |
Source: Public Records
Tax History Compared to Growth
Tax History
| Year | Tax Paid | Tax Assessment Tax Assessment Total Assessment is a certain percentage of the fair market value that is determined by local assessors to be the total taxable value of land and additions on the property. | Land | Improvement |
|---|---|---|---|---|
| 2025 | $5,497 | $519,600 | $228,300 | $291,300 |
| 2024 | $5,357 | $493,300 | $200,500 | $292,800 |
| 2023 | $5,135 | $438,900 | $177,400 | $261,500 |
| 2022 | $4,926 | $377,500 | $154,200 | $223,300 |
| 2021 | $4,635 | $351,400 | $146,500 | $204,900 |
| 2020 | $4,599 | $342,200 | $146,500 | $195,700 |
| 2019 | $4,460 | $314,300 | $138,800 | $175,500 |
| 2018 | $4,244 | $297,400 | $131,100 | $166,300 |
| 2017 | $4,131 | $282,000 | $131,100 | $150,900 |
| 2016 | $4,131 | $278,900 | $131,100 | $147,800 |
| 2015 | $3,870 | $265,100 | $123,400 | $141,700 |
Source: Public Records
Map
Nearby Homes
- 86 Comet Rd
- 5 Harmony Ln
- 4 Alderbrook Ln
- 3 Thissell St
- 49 Golf Ave
- 63 Lippold St
- 6 Aberdeen Rd
- 29 Meadowbrook Rd
- 3 Woekel Terrace
- 2 Goodrich Ave
- 128 Pleasant Valley St
- 43 Duston Dr
- 37 Albion St
- 23 Constitution Way Unit 23
- 23 Constitution Way
- 122 Pleasant Valley St
- 95 Pilgrim Cir Unit 95
- 115 Merrimack Rd
- 29 Wallace St
- 15 Swan Ave