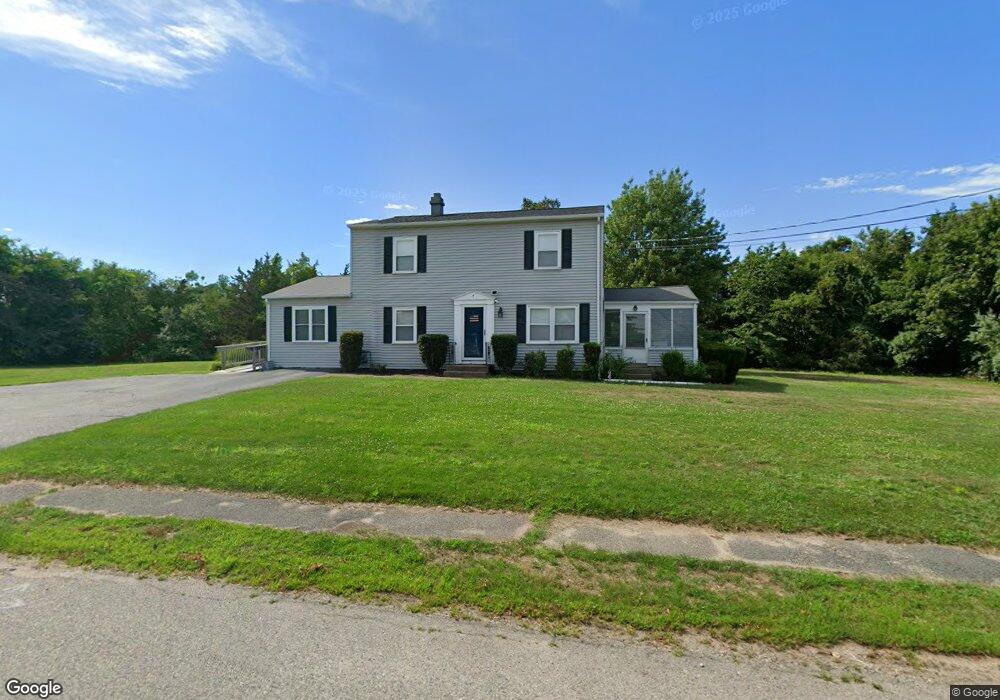
7 Chandler Dr Marshfield, MA 02050
Estimated Value: $704,000 - $750,000
5
Beds
3
Baths
1,800
Sq Ft
$402/Sq Ft
Est. Value
About This Home
This home is located at 7 Chandler Dr, Marshfield, MA 02050 and is currently estimated at $723,354, approximately $401 per square foot. 7 Chandler Dr is a home located in Plymouth County with nearby schools including Daniel Webster, Furnace Brook Middle School, and Marshfield High School.
Ownership History
Date
Name
Owned For
Owner Type
Purchase Details
Closed on
May 6, 2021
Sold by
Obrien Carolyn A and Mandeville James F
Bought by
Evans David P and Evans Maryanne
Current Estimated Value
Home Financials for this Owner
Home Financials are based on the most recent Mortgage that was taken out on this home.
Original Mortgage
$363,959
Outstanding Balance
$329,838
Interest Rate
3.1%
Mortgage Type
FHA
Estimated Equity
$393,516
Purchase Details
Closed on
Feb 1, 2021
Sold by
Anne M Mandeville Ft
Bought by
Obrien Carolyn A and Mandeville James F
Purchase Details
Closed on
Nov 16, 2007
Sold by
Mandeville Anne M
Bought by
Anne M Mandeville Ft and Mandeville James F
Create a Home Valuation Report for This Property
The Home Valuation Report is an in-depth analysis detailing your home's value as well as a comparison with similar homes in the area
Home Values in the Area
Average Home Value in this Area
Purchase History
| Date | Buyer | Sale Price | Title Company |
|---|---|---|---|
| Evans David P | $333,333 | None Available | |
| Obrien Carolyn A | -- | None Available | |
| Anne M Mandeville Ft | -- | -- |
Source: Public Records
Mortgage History
| Date | Status | Borrower | Loan Amount |
|---|---|---|---|
| Open | Evans David P | $363,959 |
Source: Public Records
Tax History
| Year | Tax Paid | Tax Assessment Tax Assessment Total Assessment is a certain percentage of the fair market value that is determined by local assessors to be the total taxable value of land and additions on the property. | Land | Improvement |
|---|---|---|---|---|
| 2025 | $5,851 | $591,000 | $310,400 | $280,600 |
| 2024 | $5,721 | $550,600 | $295,600 | $255,000 |
| 2023 | $5,311 | $485,800 | $264,000 | $221,800 |
| 2022 | $5,311 | $410,100 | $221,700 | $188,400 |
| 2021 | $5,157 | $391,000 | $221,700 | $169,300 |
| 2020 | $4,867 | $365,100 | $200,600 | $164,500 |
| 2019 | $5,088 | $380,300 | $200,600 | $179,700 |
| 2018 | $5,035 | $376,600 | $200,600 | $176,000 |
| 2017 | $4,919 | $358,500 | $200,600 | $157,900 |
| 2016 | $4,821 | $347,300 | $200,600 | $146,700 |
| 2015 | $4,566 | $343,600 | $200,600 | $143,000 |
| 2014 | $4,467 | $336,100 | $200,600 | $135,500 |
Source: Public Records
Map
Nearby Homes
- 7 Pierce Rd
- 42 Carr Rd
- 30 Chandler Dr
- 92 Salt Meadow Waye
- 32 Gratto Rd
- 290 S River St
- 155 Quincy Ave
- 6 Maple Ln
- 86 Barouche Dr
- 431 Moraine St
- 116 Outlook Rd
- 152 Acorn St
- 39 High Beacon Way
- 184 King Phillips Pathe
- 14 Ferry St
- 235 Main St
- 85 Constitution Rd
- 16 Schooner Way
- 86 Telegraph Hill Rd
- 29 Spyglass Landing Dr
Your Personal Tour Guide
Ask me questions while you tour the home.