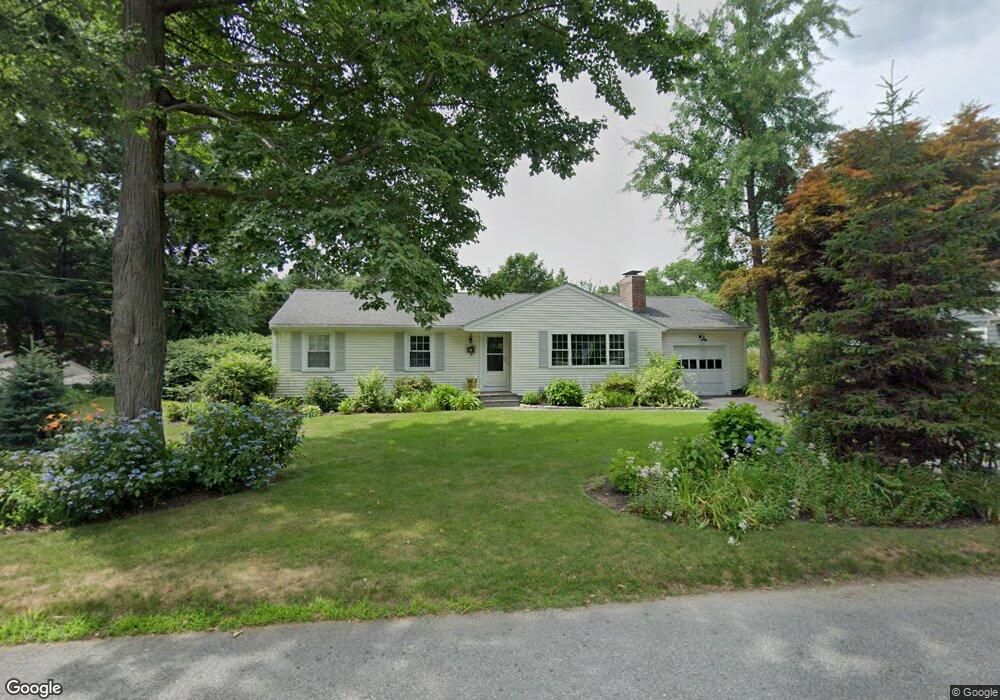
7 Charles St Wayland, MA 01778
Estimated Value: $696,000 - $999,000
3
Beds
1
Bath
1,288
Sq Ft
$656/Sq Ft
Est. Value
About This Home
This home is located at 7 Charles St, Wayland, MA 01778 and is currently estimated at $844,292, approximately $655 per square foot. 7 Charles St is a home located in Middlesex County with nearby schools including Wayland High School and Veritas Christian Academy.
Ownership History
Date
Name
Owned For
Owner Type
Purchase Details
Closed on
Jul 23, 2025
Sold by
Greenwood Patricia A and Greenwood Roy D
Bought by
Murphy Daniel and Murphy Stephanie L
Current Estimated Value
Home Financials for this Owner
Home Financials are based on the most recent Mortgage that was taken out on this home.
Original Mortgage
$696,500
Outstanding Balance
$694,722
Interest Rate
6.84%
Mortgage Type
New Conventional
Estimated Equity
$149,570
Purchase Details
Closed on
Sep 29, 2000
Sold by
Lois H Reese Ret and Rawson-Reese
Bought by
Greenwood Roy D and Greenwood Patricia A
Create a Home Valuation Report for This Property
The Home Valuation Report is an in-depth analysis detailing your home's value as well as a comparison with similar homes in the area
Home Values in the Area
Average Home Value in this Area
Purchase History
| Date | Buyer | Sale Price | Title Company |
|---|---|---|---|
| Murphy Daniel | $995,000 | -- | |
| Murphy Daniel | $995,000 | -- | |
| Greenwood Roy D | $317,000 | -- |
Source: Public Records
Mortgage History
| Date | Status | Borrower | Loan Amount |
|---|---|---|---|
| Open | Murphy Daniel | $696,500 | |
| Closed | Murphy Daniel | $696,500 | |
| Previous Owner | Greenwood Roy D | $164,000 | |
| Previous Owner | Greenwood Roy D | $75,000 |
Source: Public Records
Tax History Compared to Growth
Tax History
| Year | Tax Paid | Tax Assessment Tax Assessment Total Assessment is a certain percentage of the fair market value that is determined by local assessors to be the total taxable value of land and additions on the property. | Land | Improvement |
|---|---|---|---|---|
| 2025 | $10,819 | $692,200 | $402,700 | $289,500 |
| 2024 | $10,235 | $659,500 | $383,500 | $276,000 |
| 2023 | $10,142 | $609,100 | $348,700 | $260,400 |
| 2022 | $9,146 | $498,400 | $288,700 | $209,700 |
| 2021 | $8,714 | $470,500 | $262,400 | $208,100 |
| 2020 | $8,356 | $470,500 | $262,400 | $208,100 |
| 2019 | $8,224 | $449,900 | $250,000 | $199,900 |
| 2018 | $7,582 | $420,500 | $250,000 | $170,500 |
| 2017 | $7,401 | $408,000 | $238,100 | $169,900 |
| 2016 | $6,908 | $398,400 | $233,400 | $165,000 |
| 2015 | $7,327 | $398,400 | $233,400 | $165,000 |
Source: Public Records
Map
Nearby Homes