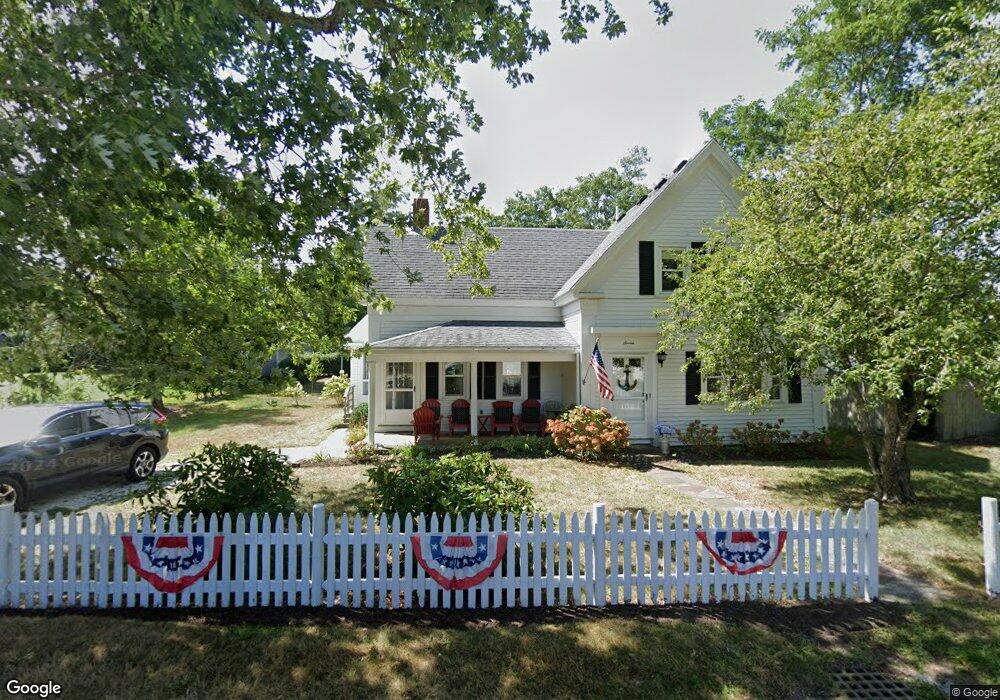
7 Chase St Dennis Port, MA 02639
Dennis Port NeighborhoodEstimated Value: $625,000 - $787,000
3
Beds
2
Baths
1,301
Sq Ft
$542/Sq Ft
Est. Value
About This Home
This home is located at 7 Chase St, Dennis Port, MA 02639 and is currently estimated at $705,718, approximately $542 per square foot. 7 Chase St is a home located in Barnstable County with nearby schools including Dennis-Yarmouth Regional High School and St. Pius X. School.
Ownership History
Date
Name
Owned For
Owner Type
Purchase Details
Closed on
Jul 31, 2020
Sold by
Beachtime Properties Llc
Bought by
Broyles Joel B and Broyles Jennifer A
Current Estimated Value
Purchase Details
Closed on
Aug 3, 2015
Sold by
Chase Street Llc
Bought by
Beachtime Properties L
Purchase Details
Closed on
Mar 2, 2007
Sold by
Shapiro
Bought by
Shapiro Diana and Shapiro Yefim
Create a Home Valuation Report for This Property
The Home Valuation Report is an in-depth analysis detailing your home's value as well as a comparison with similar homes in the area
Home Values in the Area
Average Home Value in this Area
Purchase History
| Date | Buyer | Sale Price | Title Company |
|---|---|---|---|
| Broyles Joel B | -- | None Available | |
| Broyles Joel B | -- | None Available | |
| Beachtime Properties L | $300,000 | -- | |
| Beachtime Properties L | $300,000 | -- | |
| Shapiro Diana | -- | -- | |
| Shapiro Diana | -- | -- |
Source: Public Records
Tax History Compared to Growth
Tax History
| Year | Tax Paid | Tax Assessment Tax Assessment Total Assessment is a certain percentage of the fair market value that is determined by local assessors to be the total taxable value of land and additions on the property. | Land | Improvement |
|---|---|---|---|---|
| 2025 | $2,658 | $613,800 | $341,000 | $272,800 |
| 2024 | $2,557 | $582,400 | $327,900 | $254,500 |
| 2023 | $2,473 | $529,600 | $298,100 | $231,500 |
| 2022 | $2,223 | $397,000 | $235,000 | $162,000 |
| 2021 | $2,259 | $374,700 | $230,300 | $144,400 |
| 2020 | $2,277 | $373,200 | $230,300 | $142,900 |
| 2019 | $2,432 | $394,200 | $245,200 | $149,000 |
| 2018 | $2,303 | $363,200 | $233,400 | $129,800 |
| 2017 | $2,149 | $349,400 | $215,000 | $134,400 |
| 2016 | $2,214 | $339,000 | $202,700 | $136,300 |
| 2015 | $2,240 | $350,000 | $202,700 | $147,300 |
| 2014 | -- | $342,700 | $190,400 | $152,300 |
Source: Public Records
Map
Nearby Homes
- 12 Cross St
- 102 Sea St
- 26 Manning Rd
- 402 Old Wharf Rd
- 402 Old Wharf Rd
- 11 Ocean Park W
- 159 Center St Unit 22
- 405 Old Wharf Rd Unit B204
- 405 Old Wharf Rd Unit B204
- 22 Ferncliff Rd
- 9 Chase Ave Unit 6
- 37-A Beach Hills Rd
- 1 E Belmont Unit 630
- 73 Division St
- 37 Beach Hills Rd
- 1 Belmont Rd Unit 630
- 1 Belmont Rd Unit 513
- 10 Candlewood Ln Unit 2-1
- 12 Candlewood Ln Unit 2-9
- 221 Upper County Rd Unit 2A