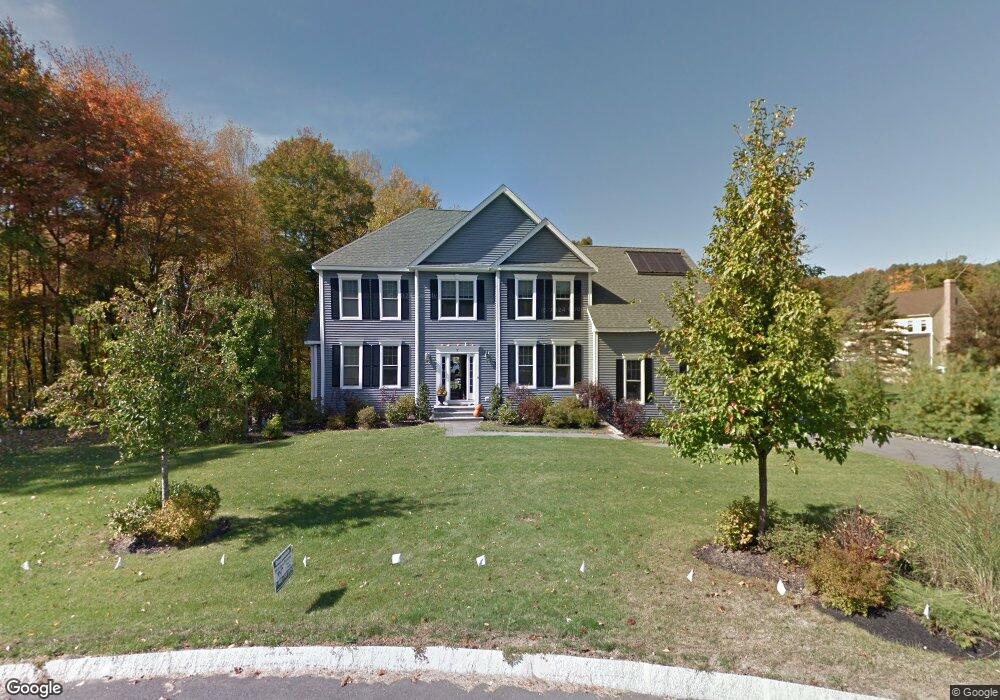
7 Chickering Ln Ashland, MA 01721
Estimated Value: $990,405 - $1,304,000
4
Beds
3
Baths
2,524
Sq Ft
$461/Sq Ft
Est. Value
About This Home
This home is located at 7 Chickering Ln, Ashland, MA 01721 and is currently estimated at $1,164,351, approximately $461 per square foot. 7 Chickering Ln is a home located in Middlesex County with nearby schools including William Pittaway Elementary School, David Mindess Elementary School, and Henry E. Warren Elementary School.
Ownership History
Date
Name
Owned For
Owner Type
Purchase Details
Closed on
Jun 27, 2025
Sold by
Duca Anthony and Duca Melissa
Bought by
Obrien Patrick A and Obrien Stefanie
Current Estimated Value
Purchase Details
Closed on
Oct 20, 2009
Sold by
Absolut Rt and Depietri
Bought by
Duca Anthony and Duca Melissa
Purchase Details
Closed on
Sep 18, 2009
Sold by
Tosi Eric R and Rosewood Capital Corp
Bought by
Absolut Rt and Depietri
Create a Home Valuation Report for This Property
The Home Valuation Report is an in-depth analysis detailing your home's value as well as a comparison with similar homes in the area
Home Values in the Area
Average Home Value in this Area
Purchase History
| Date | Buyer | Sale Price | Title Company |
|---|---|---|---|
| Obrien Patrick A | $1,305,000 | -- | |
| Obrien Patrick A | $1,305,000 | -- | |
| Duca Anthony | $175,000 | -- | |
| Duca Anthony | $175,000 | -- | |
| Duca Anthony | $175,000 | -- | |
| Absolut Rt | $325,000 | -- | |
| Absolut Rt | $325,000 | -- | |
| Absolut Rt | $325,000 | -- |
Source: Public Records
Mortgage History
| Date | Status | Borrower | Loan Amount |
|---|---|---|---|
| Previous Owner | Absolut Rt | $392,000 | |
| Previous Owner | Absolut Rt | $394,000 | |
| Previous Owner | Absolut Rt | $393,000 |
Source: Public Records
Tax History
| Year | Tax Paid | Tax Assessment Tax Assessment Total Assessment is a certain percentage of the fair market value that is determined by local assessors to be the total taxable value of land and additions on the property. | Land | Improvement |
|---|---|---|---|---|
| 2025 | $12,635 | $989,400 | $316,300 | $673,100 |
| 2024 | $12,275 | $927,100 | $316,300 | $610,800 |
| 2023 | $10,743 | $780,200 | $301,300 | $478,900 |
| 2022 | $10,873 | $684,700 | $273,600 | $411,100 |
| 2021 | $10,421 | $654,200 | $273,600 | $380,600 |
| 2020 | $10,302 | $637,500 | $273,600 | $363,900 |
| 2019 | $10,042 | $616,800 | $273,600 | $343,200 |
| 2018 | $9,948 | $598,900 | $269,300 | $329,600 |
| 2017 | $9,850 | $589,800 | $268,100 | $321,700 |
| 2016 | $9,775 | $575,000 | $268,100 | $306,900 |
| 2015 | $9,750 | $563,600 | $256,100 | $307,500 |
| 2014 | $9,505 | $546,600 | $238,100 | $308,500 |
Source: Public Records
Map
Nearby Homes
- 94 Myrtle St
- 37 Riverview Dr
- 66 Cedar Hill Rd
- 96 Pleasant St Unit 96
- 0 Ballard Highland Marietta Unit 73391306
- 327 Singletary Ln
- 203 Pleasant St
- 257-259 Main St
- 15 Bellmore Rd
- 0 Oregon Rd
- 10 Metropolitan Ave
- 10 Foothill Rd
- 431 America Blvd Unit 64D
- 437 America Blvd Unit 437
- 81 Edgewater Dr
- 1500 Worcester Rd Unit 221
- 1500 Worcester Rd Unit 118
- 1500 Worcester Rd Unit 426
- 1550 Worcester Rd Unit 101
- 22 Gryzboska Cir
Your Personal Tour Guide
Ask me questions while you tour the home.