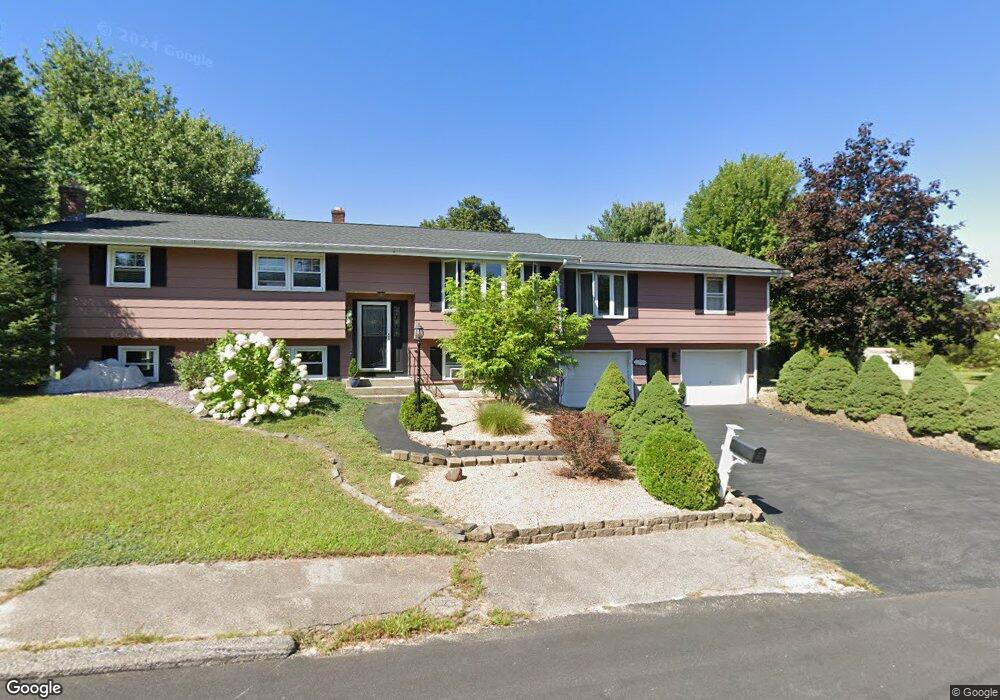
7 Christine Rd Bellingham, MA 02019
Estimated Value: $585,000 - $656,000
4
Beds
2
Baths
2,442
Sq Ft
$251/Sq Ft
Est. Value
About This Home
This home is located at 7 Christine Rd, Bellingham, MA 02019 and is currently estimated at $612,906, approximately $250 per square foot. 7 Christine Rd is a home located in Norfolk County with nearby schools including Joseph F. DiPietro Elementary, Bellingham High School, and Rise Prep Mayoral Academy Middle School.
Ownership History
Date
Name
Owned For
Owner Type
Purchase Details
Closed on
Jul 31, 2003
Sold by
Merjik Raffi and Merjik Galina V
Bought by
Newcombe Jeffrey R
Current Estimated Value
Home Financials for this Owner
Home Financials are based on the most recent Mortgage that was taken out on this home.
Original Mortgage
$215,000
Outstanding Balance
$92,330
Interest Rate
5.28%
Mortgage Type
Purchase Money Mortgage
Estimated Equity
$520,576
Purchase Details
Closed on
Dec 28, 2001
Sold by
Morrissette Jacques G and Morrissette Cynthia L
Bought by
Merjik Raffi
Home Financials for this Owner
Home Financials are based on the most recent Mortgage that was taken out on this home.
Original Mortgage
$252,200
Interest Rate
6.61%
Mortgage Type
Purchase Money Mortgage
Create a Home Valuation Report for This Property
The Home Valuation Report is an in-depth analysis detailing your home's value as well as a comparison with similar homes in the area
Home Values in the Area
Average Home Value in this Area
Purchase History
| Date | Buyer | Sale Price | Title Company |
|---|---|---|---|
| Newcombe Jeffrey R | $325,000 | -- | |
| Merjik Raffi | $260,000 | -- |
Source: Public Records
Mortgage History
| Date | Status | Borrower | Loan Amount |
|---|---|---|---|
| Open | Newcombe Jeffrey R | $215,000 | |
| Previous Owner | Merjik Raffi | $252,200 |
Source: Public Records
Tax History Compared to Growth
Tax History
| Year | Tax Paid | Tax Assessment Tax Assessment Total Assessment is a certain percentage of the fair market value that is determined by local assessors to be the total taxable value of land and additions on the property. | Land | Improvement |
|---|---|---|---|---|
| 2025 | $6,497 | $517,300 | $167,200 | $350,100 |
| 2024 | $6,184 | $480,900 | $152,700 | $328,200 |
| 2023 | $5,957 | $456,500 | $145,400 | $311,100 |
| 2022 | $5,497 | $390,400 | $121,200 | $269,200 |
| 2021 | $5,316 | $368,900 | $121,200 | $247,700 |
| 2020 | $5,122 | $360,200 | $121,200 | $239,000 |
| 2019 | $5,008 | $352,400 | $121,200 | $231,200 |
| 2018 | $4,679 | $324,700 | $116,600 | $208,100 |
| 2017 | $4,530 | $315,900 | $116,600 | $199,300 |
| 2016 | $4,321 | $302,400 | $114,600 | $187,800 |
| 2015 | $4,144 | $290,800 | $110,200 | $180,600 |
| 2014 | $4,149 | $283,000 | $107,700 | $175,300 |
Source: Public Records
Map
Nearby Homes