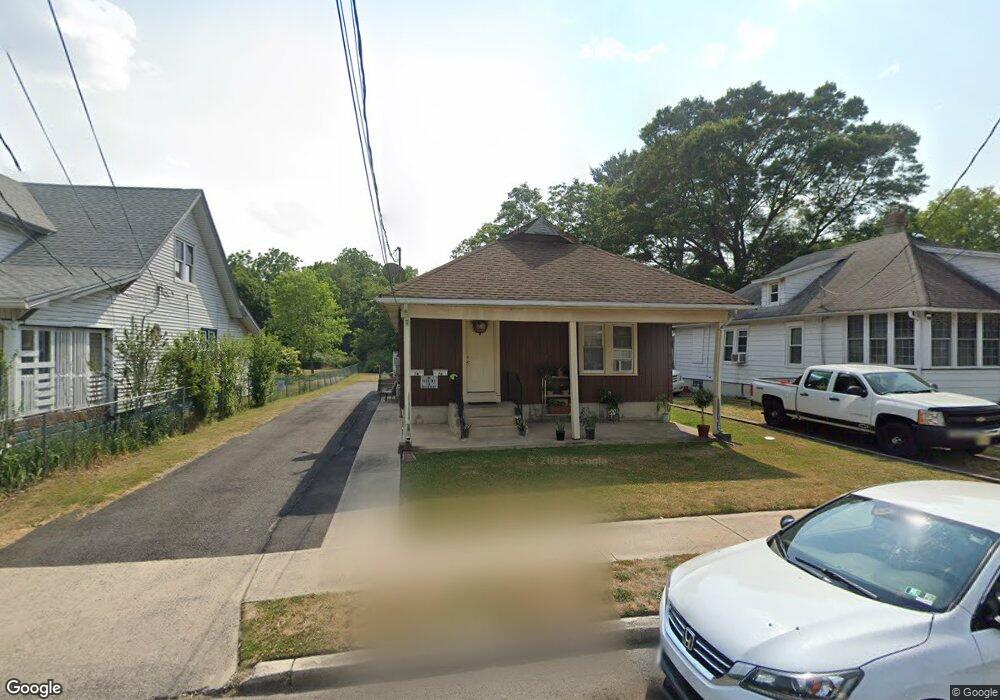
7 Church St Glassboro, NJ 08028
Estimated Value: $282,432 - $331,000
--
Bed
--
Bath
1,664
Sq Ft
$189/Sq Ft
Est. Value
About This Home
This home is located at 7 Church St, Glassboro, NJ 08028 and is currently estimated at $314,108, approximately $188 per square foot. 7 Church St is a home located in Gloucester County with nearby schools including J Harvey Rodgers School, Dorothy L Bullock Elementary, and Glassboro Intermediate School.
Ownership History
Date
Name
Owned For
Owner Type
Purchase Details
Closed on
Aug 22, 2003
Sold by
Miller Andrew W and Miller Susan R
Bought by
Palladino George and Palladino Lillian
Current Estimated Value
Home Financials for this Owner
Home Financials are based on the most recent Mortgage that was taken out on this home.
Original Mortgage
$76,000
Interest Rate
5.29%
Mortgage Type
Purchase Money Mortgage
Purchase Details
Closed on
Mar 6, 2003
Sold by
Hud
Bought by
Miller Andrew W and Miller Susan R
Purchase Details
Closed on
Oct 28, 2002
Sold by
Clark Steven C and Clark Christina
Bought by
Hud
Purchase Details
Closed on
Jul 31, 1998
Sold by
Jaconelli Michael J
Bought by
Clark Steven C
Home Financials for this Owner
Home Financials are based on the most recent Mortgage that was taken out on this home.
Original Mortgage
$99,949
Interest Rate
6.92%
Mortgage Type
FHA
Create a Home Valuation Report for This Property
The Home Valuation Report is an in-depth analysis detailing your home's value as well as a comparison with similar homes in the area
Home Values in the Area
Average Home Value in this Area
Purchase History
| Date | Buyer | Sale Price | Title Company |
|---|---|---|---|
| Palladino George | $95,000 | Group 21 | |
| Miller Andrew W | $65,000 | Independence Abstract & Titl | |
| Hud | -- | -- | |
| Clark Steven C | $100,300 | New Jersey Title Insurance C |
Source: Public Records
Mortgage History
| Date | Status | Borrower | Loan Amount |
|---|---|---|---|
| Closed | Palladino George | $76,000 | |
| Previous Owner | Clark Steven C | $99,949 |
Source: Public Records
Tax History Compared to Growth
Tax History
| Year | Tax Paid | Tax Assessment Tax Assessment Total Assessment is a certain percentage of the fair market value that is determined by local assessors to be the total taxable value of land and additions on the property. | Land | Improvement |
|---|---|---|---|---|
| 2025 | $6,111 | $173,600 | $57,900 | $115,700 |
| 2024 | $6,074 | $173,600 | $57,900 | $115,700 |
| 2023 | $6,074 | $173,600 | $57,900 | $115,700 |
| 2022 | $6,014 | $173,600 | $57,900 | $115,700 |
| 2021 | $6,116 | $173,600 | $57,900 | $115,700 |
| 2020 | $6,151 | $173,600 | $57,900 | $115,700 |
| 2019 | $6,161 | $173,600 | $57,900 | $115,700 |
| 2018 | $6,165 | $173,600 | $57,900 | $115,700 |
| 2017 | $6,194 | $173,600 | $57,900 | $115,700 |
| 2016 | $6,015 | $173,600 | $57,900 | $115,700 |
| 2015 | $5,885 | $173,600 | $57,900 | $115,700 |
| 2014 | $5,751 | $173,600 | $57,900 | $115,700 |
Source: Public Records
Map
Nearby Homes