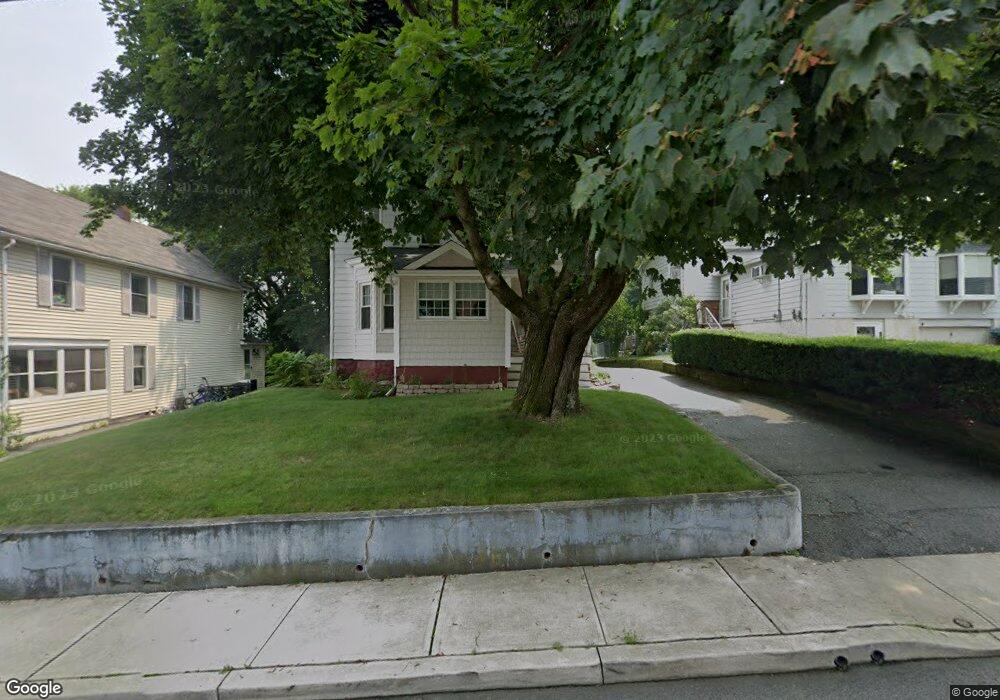
7 Church St Netcong, NJ 07857
Estimated Value: $455,000 - $498,000
--
Bed
--
Bath
1,788
Sq Ft
$266/Sq Ft
Est. Value
About This Home
This home is located at 7 Church St, Netcong, NJ 07857 and is currently estimated at $475,888, approximately $266 per square foot. 7 Church St is a home located in Morris County with nearby schools including Netcong Elementary School, Lenape Val Regional High School, and St. Therese School.
Ownership History
Date
Name
Owned For
Owner Type
Purchase Details
Closed on
Jan 15, 2003
Sold by
Garlick Kathryn
Bought by
Podgurski John and Podgurski Kelly
Current Estimated Value
Home Financials for this Owner
Home Financials are based on the most recent Mortgage that was taken out on this home.
Original Mortgage
$180,975
Outstanding Balance
$77,600
Interest Rate
6.09%
Estimated Equity
$398,288
Purchase Details
Closed on
Sep 21, 1996
Sold by
Kelley Alice M
Bought by
Kelley Alice M and Kelley William H
Create a Home Valuation Report for This Property
The Home Valuation Report is an in-depth analysis detailing your home's value as well as a comparison with similar homes in the area
Home Values in the Area
Average Home Value in this Area
Purchase History
| Date | Buyer | Sale Price | Title Company |
|---|---|---|---|
| Podgurski John | $190,500 | -- | |
| Kelley Alice M | -- | -- |
Source: Public Records
Mortgage History
| Date | Status | Borrower | Loan Amount |
|---|---|---|---|
| Open | Podgurski John | $180,975 |
Source: Public Records
Tax History Compared to Growth
Tax History
| Year | Tax Paid | Tax Assessment Tax Assessment Total Assessment is a certain percentage of the fair market value that is determined by local assessors to be the total taxable value of land and additions on the property. | Land | Improvement |
|---|---|---|---|---|
| 2025 | $9,626 | $281,700 | $125,600 | $156,100 |
| 2024 | $9,710 | $281,700 | $125,600 | $156,100 |
| 2023 | $9,710 | $281,700 | $125,600 | $156,100 |
| 2022 | $8,797 | $281,700 | $125,600 | $156,100 |
| 2021 | $8,797 | $281,700 | $125,600 | $156,100 |
| 2020 | $8,677 | $282,100 | $159,300 | $122,800 |
| 2019 | $8,260 | $282,100 | $159,300 | $122,800 |
| 2018 | $7,766 | $282,100 | $159,300 | $122,800 |
| 2017 | $7,462 | $282,100 | $159,300 | $122,800 |
| 2016 | $7,258 | $282,100 | $159,300 | $122,800 |
| 2015 | $6,993 | $282,100 | $159,300 | $122,800 |
| 2014 | $6,689 | $282,100 | $159,300 | $122,800 |
Source: Public Records
Map
Nearby Homes