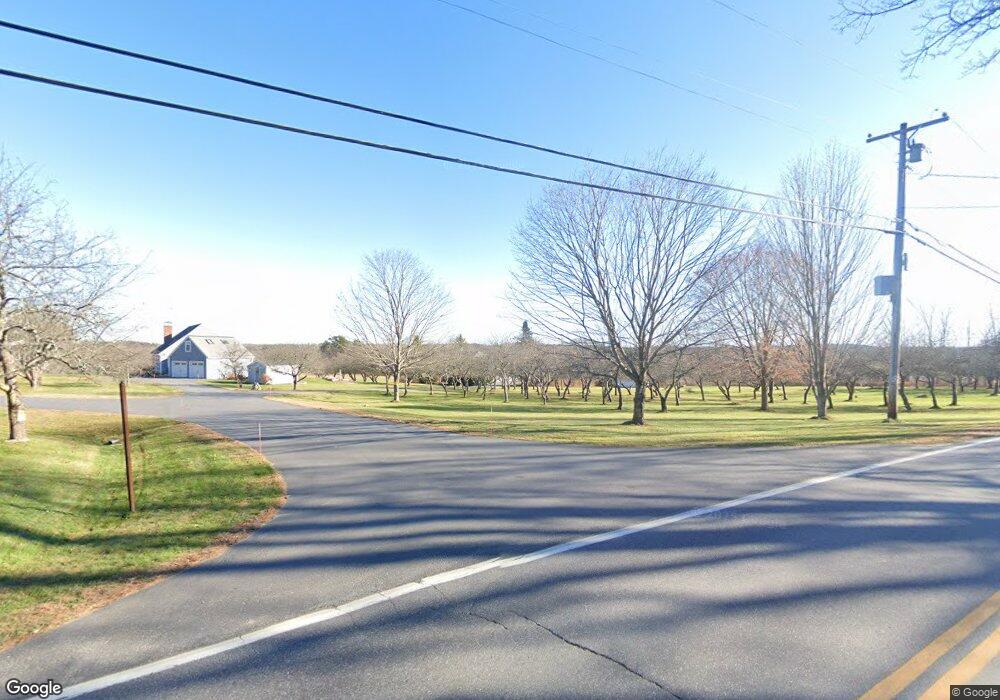
7 Cider Run Topsham, ME 04086
Estimated Value: $601,000 - $768,000
3
Beds
2
Baths
2,505
Sq Ft
$262/Sq Ft
Est. Value
About This Home
This home is located at 7 Cider Run, Topsham, ME 04086 and is currently estimated at $656,030, approximately $261 per square foot. 7 Cider Run is a home located in Sagadahoc County with nearby schools including Mt Ararat High School and St John's Catholic School.
Ownership History
Date
Name
Owned For
Owner Type
Purchase Details
Closed on
Nov 23, 2009
Sold by
Brewer John W and Brewer Dawn E
Bought by
Connor Donald C and Connor Sara J
Current Estimated Value
Home Financials for this Owner
Home Financials are based on the most recent Mortgage that was taken out on this home.
Original Mortgage
$175,000
Outstanding Balance
$112,982
Interest Rate
4.86%
Mortgage Type
Unknown
Estimated Equity
$543,048
Purchase Details
Closed on
Jan 4, 2008
Sold by
Gray Terry D and Gray Francesca
Bought by
Bryce James R and Bryce 2Nd Robert E
Home Financials for this Owner
Home Financials are based on the most recent Mortgage that was taken out on this home.
Original Mortgage
$324,000
Interest Rate
6.27%
Mortgage Type
Unknown
Create a Home Valuation Report for This Property
The Home Valuation Report is an in-depth analysis detailing your home's value as well as a comparison with similar homes in the area
Home Values in the Area
Average Home Value in this Area
Purchase History
| Date | Buyer | Sale Price | Title Company |
|---|---|---|---|
| Connor Donald C | -- | -- | |
| Bryce James R | -- | -- |
Source: Public Records
Mortgage History
| Date | Status | Borrower | Loan Amount |
|---|---|---|---|
| Open | Bryce James R | $175,000 | |
| Previous Owner | Bryce James R | $324,000 | |
| Previous Owner | Bryce James R | $64,559 |
Source: Public Records
Tax History
| Year | Tax Paid | Tax Assessment Tax Assessment Total Assessment is a certain percentage of the fair market value that is determined by local assessors to be the total taxable value of land and additions on the property. | Land | Improvement |
|---|---|---|---|---|
| 2025 | $8,480 | $662,500 | $85,500 | $577,000 |
| 2024 | $8,354 | $668,300 | $80,900 | $587,400 |
| 2023 | $8,162 | $601,000 | $78,000 | $523,000 |
| 2022 | $7,095 | $492,000 | $75,900 | $416,100 |
| 2021 | $6,926 | $436,400 | $71,400 | $365,000 |
| 2020 | $3,057 | $390,900 | $71,400 | $319,500 |
| 2019 | $3,007 | $350,800 | $71,400 | $279,400 |
| 2018 | $2,978 | $334,800 | $66,000 | $268,800 |
| 2017 | $6,067 | $334,800 | $66,000 | $268,800 |
| 2016 | $2,819 | $329,400 | $66,000 | $263,400 |
| 2015 | $5,722 | $318,600 | $66,000 | $252,600 |
| 2014 | $5,334 | $307,800 | $66,000 | $241,800 |
| 2013 | $5,125 | $307,800 | $66,000 | $241,800 |
Source: Public Records
Map
Nearby Homes
Your Personal Tour Guide
Ask me questions while you tour the home.