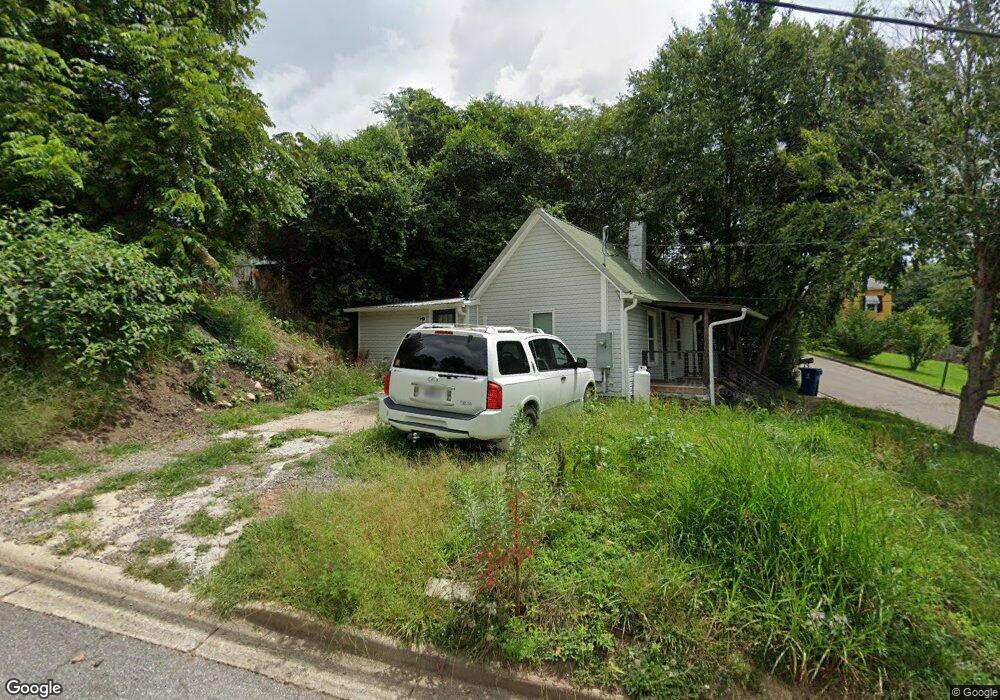
7 Clay St Canton, NC 28716
Estimated Value: $151,611 - $224,000
2
Beds
1
Bath
720
Sq Ft
$242/Sq Ft
Est. Value
About This Home
This home is located at 7 Clay St, Canton, NC 28716 and is currently estimated at $173,903, approximately $241 per square foot. 7 Clay St is a home located in Haywood County with nearby schools including North Canton Elementary School, Canton Middle, and Pisgah High School.
Ownership History
Date
Name
Owned For
Owner Type
Purchase Details
Closed on
Mar 23, 2023
Sold by
Ldw 2 Properties Llc
Bought by
Bilanski Frazier Stacy and Bilanski Keith Truax
Current Estimated Value
Home Financials for this Owner
Home Financials are based on the most recent Mortgage that was taken out on this home.
Original Mortgage
$96,000
Outstanding Balance
$92,322
Interest Rate
5%
Mortgage Type
New Conventional
Estimated Equity
$81,581
Purchase Details
Closed on
Jan 9, 2020
Sold by
Cogburn Wanda Faye and County Of Haywood
Bought by
Ldw 2 Properties Llc
Purchase Details
Closed on
Apr 29, 1996
Bought by
Cogburn Wanda Faye
Create a Home Valuation Report for This Property
The Home Valuation Report is an in-depth analysis detailing your home's value as well as a comparison with similar homes in the area
Home Values in the Area
Average Home Value in this Area
Purchase History
| Date | Buyer | Sale Price | Title Company |
|---|---|---|---|
| Bilanski Frazier Stacy | $120,000 | -- | |
| Ldw 2 Properties Llc | $10,000 | None Available | |
| Cogburn Wanda Faye | -- | -- |
Source: Public Records
Mortgage History
| Date | Status | Borrower | Loan Amount |
|---|---|---|---|
| Open | Bilanski Frazier Stacy | $96,000 |
Source: Public Records
Tax History
| Year | Tax Paid | Tax Assessment Tax Assessment Total Assessment is a certain percentage of the fair market value that is determined by local assessors to be the total taxable value of land and additions on the property. | Land | Improvement |
|---|---|---|---|---|
| 2025 | -- | $95,900 | $15,400 | $80,500 |
| 2024 | $7 | $95,900 | $15,400 | $80,500 |
| 2023 | $597 | $79,600 | $15,400 | $64,200 |
| 2022 | $585 | $79,600 | $15,400 | $64,200 |
| 2021 | $585 | $79,600 | $15,400 | $64,200 |
| 2020 | $380 | $37,700 | $12,100 | $25,600 |
| 2019 | $385 | $37,700 | $12,100 | $25,600 |
| 2018 | $385 | $37,700 | $12,100 | $25,600 |
| 2017 | $385 | $37,700 | $0 | $0 |
| 2016 | $381 | $38,400 | $0 | $0 |
| 2015 | $381 | $38,400 | $0 | $0 |
| 2014 | $300 | $38,400 | $0 | $0 |
Source: Public Records
Map
Nearby Homes
- 223 N Main St
- 99999 Allen St
- 118 Mitchell St
- 62 Mitchell St
- 151 Hampton Heights Rd
- 3 Elizabeth St
- 30 Woodruff St
- 412 Trammell Ave
- 318 Academy St
- 622 N Main St
- 40 Warner Rd
- 761 N Main St
- 239 Northside St
- 213 Northridge Dr
- 195 Terrace Dr
- 172 Reed St
- 284 Northridge Dr
- TBD Valley St
- 121 Johnson St
- 00 Bob Wood Dr
Your Personal Tour Guide
Ask me questions while you tour the home.