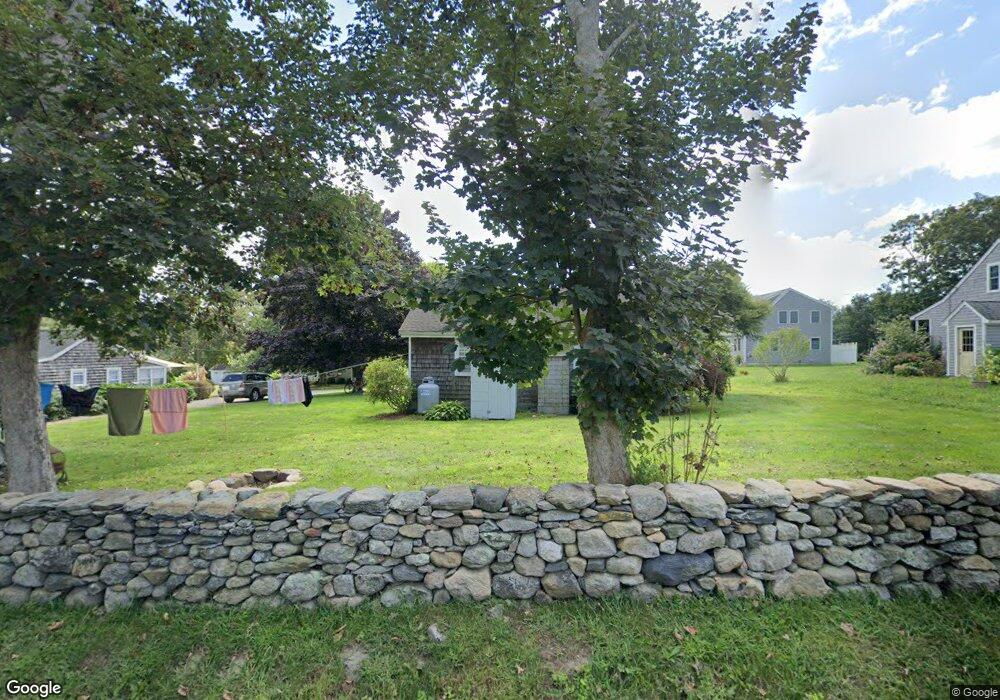
7 Clover Meadows Rd Little Compton, RI 02837
Estimated Value: $572,000 - $1,060,000
2
Beds
1
Bath
672
Sq Ft
$1,178/Sq Ft
Est. Value
About This Home
This home is located at 7 Clover Meadows Rd, Little Compton, RI 02837 and is currently estimated at $791,745, approximately $1,178 per square foot. 7 Clover Meadows Rd is a home located in Newport County with nearby schools including Wilbur & McMahon School.
Ownership History
Date
Name
Owned For
Owner Type
Purchase Details
Closed on
Sep 26, 2023
Sold by
Corbett William L
Bought by
Corbett Rt and Corbett
Current Estimated Value
Purchase Details
Closed on
Aug 25, 2016
Sold by
Poitras Richard R and Poitras Beverly J
Bought by
Corbett William J and Corbett Susan L
Home Financials for this Owner
Home Financials are based on the most recent Mortgage that was taken out on this home.
Original Mortgage
$240,000
Interest Rate
3.42%
Mortgage Type
New Conventional
Purchase Details
Closed on
Jun 28, 2006
Sold by
Willard Daniel and Willard Carol
Bought by
Poitras Ricahrd and Poitras Beverly
Home Financials for this Owner
Home Financials are based on the most recent Mortgage that was taken out on this home.
Original Mortgage
$250,000
Interest Rate
6.58%
Mortgage Type
Purchase Money Mortgage
Create a Home Valuation Report for This Property
The Home Valuation Report is an in-depth analysis detailing your home's value as well as a comparison with similar homes in the area
Home Values in the Area
Average Home Value in this Area
Purchase History
| Date | Buyer | Sale Price | Title Company |
|---|---|---|---|
| Corbett Rt | -- | None Available | |
| Corbett Rt | -- | None Available | |
| Corbett William J | $315,000 | -- | |
| Poitras Ricahrd | $350,000 | -- | |
| Corbett William J | $315,000 | -- | |
| Poitras Ricahrd | $350,000 | -- |
Source: Public Records
Mortgage History
| Date | Status | Borrower | Loan Amount |
|---|---|---|---|
| Previous Owner | Corbett William J | $240,000 | |
| Previous Owner | Poitras Ricahrd | $250,000 | |
| Previous Owner | Poitras Ricahrd | $50,000 |
Source: Public Records
Tax History Compared to Growth
Tax History
| Year | Tax Paid | Tax Assessment Tax Assessment Total Assessment is a certain percentage of the fair market value that is determined by local assessors to be the total taxable value of land and additions on the property. | Land | Improvement |
|---|---|---|---|---|
| 2025 | $1,692 | $353,200 | $210,200 | $143,000 |
| 2024 | $1,604 | $315,700 | $182,800 | $132,900 |
| 2023 | $1,566 | $315,700 | $182,800 | $132,900 |
| 2022 | $1,547 | $315,700 | $182,800 | $132,900 |
| 2021 | $1,353 | $224,000 | $158,900 | $65,100 |
| 2020 | $1,342 | $224,000 | $158,900 | $65,100 |
| 2019 | $1,328 | $224,000 | $158,900 | $65,100 |
| 2018 | $1,237 | $207,500 | $144,000 | $63,500 |
| 2016 | $1,177 | $207,500 | $144,000 | $63,500 |
| 2015 | $1,133 | $197,100 | $135,500 | $61,600 |
| 2014 | $1,112 | $197,100 | $135,500 | $61,600 |
Source: Public Records
Map
Nearby Homes
- 18 Old Barn Rd
- 128 Maple Ave
- 141 S Of Commons Rd
- 304 Brayton Point Rd
- 189 Brayton Point Rd
- 536 W Main Rd
- 255 John Dyer Rd
- 0 Willow Ave
- 505 Long Hwy
- 19 Seabury Ln
- 441 W Main Rd
- 245 John Dyer Rd
- 180 W Main Rd
- 17 Ferolbink Way
- 116 Amy Hart Path
- 83 Long Hwy
- 155 W Main Rd
- 1881 Main Rd
- 6 June Way
- 55 W Main Rd
- 9 Clover Meadows Rd
- 5 Clover Meadows Rd
- 8 Clover Meadows Rd
- 10 Clover Meadows Rd
- 6 Clover Meadows Rd
- 11 Shaw Rd
- 3 Clover Meadows Rd
- 4 Side Rd
- 4 Clover Meadows Rd
- 7 Indian Rd
- 5 Shaw Rd
- 65 S Shore Rd
- 5 Indian Rd
- 1 Clover Meadows Rd
- 2 Clover Meadows Rd
- 0 S Shore Rd
- 130 S Shore Rd
- 89 S Shore Rd
- 40 S Shore Rd
- 9 Indian Rd