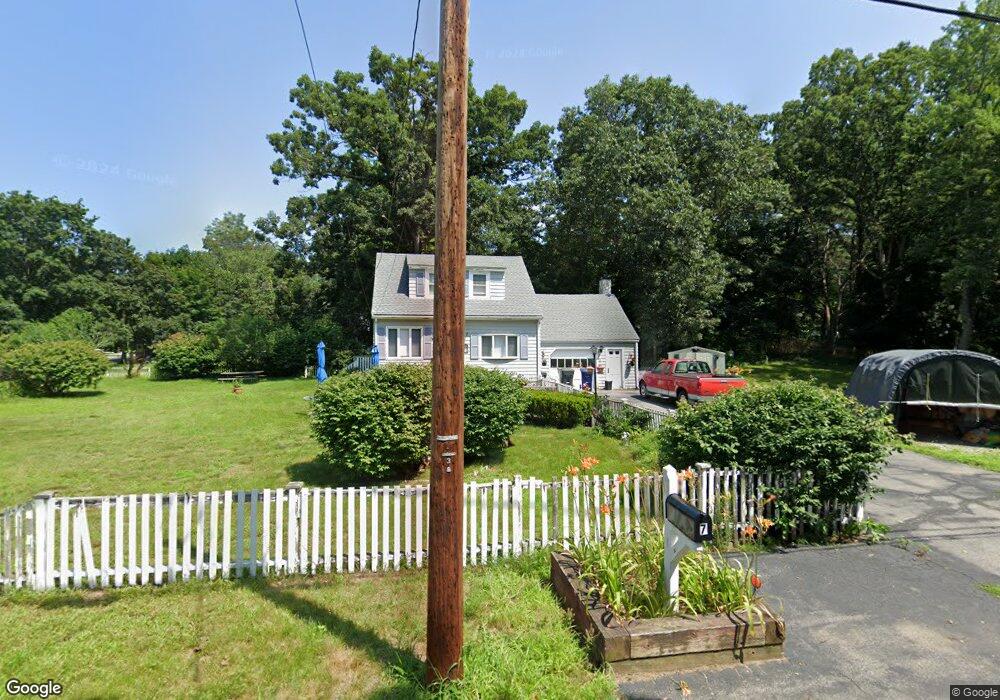
7 Cochrane Rd Wilmington, MA 01887
Estimated Value: $653,000 - $682,000
3
Beds
2
Baths
1,460
Sq Ft
$454/Sq Ft
Est. Value
About This Home
This home is located at 7 Cochrane Rd, Wilmington, MA 01887 and is currently estimated at $662,934, approximately $454 per square foot. 7 Cochrane Rd is a home located in Middlesex County with nearby schools including Wilmington Middle School, Wilmington High School, and Abundant Life Christian School and Childcare.
Ownership History
Date
Name
Owned For
Owner Type
Purchase Details
Closed on
Jan 21, 2026
Sold by
Gorman Kathleen A
Bought by
7 Cochrane Road Rt and Gorman
Current Estimated Value
Purchase Details
Closed on
Aug 3, 2016
Sold by
Robert J Gorman Sr Ret and Gorman
Bought by
Gorman Robert T and Gorman Kathleen A
Purchase Details
Closed on
Sep 14, 2011
Sold by
Gorman Robert J
Bought by
Robert J Gorman Sr Ret and Gorman
Purchase Details
Closed on
Aug 24, 1965
Bought by
Gorman Robert J
Create a Home Valuation Report for This Property
The Home Valuation Report is an in-depth analysis detailing your home's value as well as a comparison with similar homes in the area
Purchase History
| Date | Buyer | Sale Price | Title Company |
|---|---|---|---|
| 7 Cochrane Road Rt | -- | -- | |
| Gorman Robert T | -- | -- | |
| Robert J Gorman Sr Ret | -- | -- | |
| Gorman Robert J | -- | -- |
Source: Public Records
Mortgage History
| Date | Status | Borrower | Loan Amount |
|---|---|---|---|
| Previous Owner | Gorman Robert J | $57,238 |
Source: Public Records
Tax History
| Year | Tax Paid | Tax Assessment Tax Assessment Total Assessment is a certain percentage of the fair market value that is determined by local assessors to be the total taxable value of land and additions on the property. | Land | Improvement |
|---|---|---|---|---|
| 2025 | $6,276 | $548,100 | $278,000 | $270,100 |
| 2024 | $6,017 | $526,400 | $278,000 | $248,400 |
| 2023 | $5,797 | $485,500 | $252,800 | $232,700 |
| 2022 | $5,744 | $440,800 | $210,600 | $230,200 |
| 2021 | $5,468 | $395,100 | $191,400 | $203,700 |
| 2020 | $5,564 | $409,700 | $191,400 | $218,300 |
| 2019 | $5,335 | $388,000 | $182,200 | $205,800 |
| 2018 | $5,127 | $355,800 | $173,600 | $182,200 |
| 2017 | $4,738 | $327,900 | $173,600 | $154,300 |
| 2016 | $4,585 | $313,400 | $165,400 | $148,000 |
| 2015 | $4,413 | $307,100 | $165,400 | $141,700 |
| 2014 | $4,046 | $284,100 | $157,600 | $126,500 |
Source: Public Records
Map
Nearby Homes
Your Personal Tour Guide
Ask me questions while you tour the home.