P
Seller's Agent in 2025
Pam Roberts
Gibson Sotheby's International Realty
(508) 432-6100
1 in this area
33 Total Sales


Estimated Value: $2,050,149 - $3,009,000
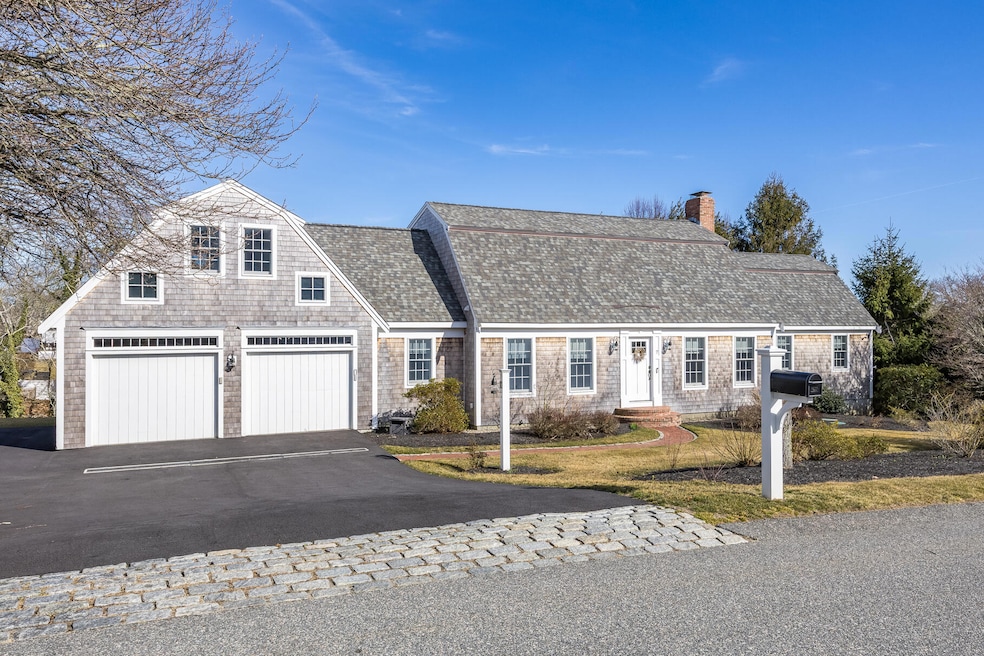
A Chatham Beauty! Welcome to 7 Colonial Drive, a distinguished residence within one of Eastward Company's sought after residential communities. This expanded Cape home, being sold fully furnished, has been thoughtfully updated for today's lifestyle...offering 4 bedrooms, 2.5 baths and three levels of living. The main level features a bright living room with fireplace, open dining with direct deck access, a chef's kitchen, a lovely family room with second fireplace and a warm and inviting primary bedroom with an elegant ensuite full bath plus two spacious closets. Conveniently located on the first floor is a half bath and a separate laundry area. On the second floor, there are two large bedrooms and a full bath. A spacious bright office space is located above the two car garage. The walk-out lower level includes a comfortable bedroom with a cozy fireplace and slider to a brick patio. An adjacent open space, enhanced by elegant arched windows with back yard views, presents unlimited possibilities to design a dream space tailored to your lifestyle.Enjoy the lovely neighborhood and the picturesque cranberry bog. Ridgevale Beach & Harding's Beach are nearby!A GEM!
Last Agent to Sell the Property
Gibson Sotheby's International Realty License #103378-B Listed on: 05/09/2025

We collect this data history from publicly available records. To have your information removed, we recommend requesting removal directly through your county’s website.
We collect this data history from publicly available records. To have your information removed, we recommend requesting removal directly through your county’s website.
| Date | Buyer | Sale Price | Title Company |
|---|---|---|---|
| $2,685,000 | -- | ||
| $2,685,000 | -- | ||
| -- | -- | ||
| -- | -- | ||
| $1,561,000 | None Available | ||
| $1,561,000 | None Available | ||
| $1,075,000 | None Available | ||
| $1,075,000 | None Available | ||
| -- | None Available | ||
| -- | None Available | ||
| -- | -- | ||
| -- | -- | ||
| $500,000 | -- | ||
| $500,000 | -- |
We collect this data history from publicly available records. To have your information removed, we recommend requesting removal directly through your county’s website.
| Date | Status | Borrower | Loan Amount |
|---|---|---|---|
| Open | $1,855,000 | ||
| Closed | $1,855,000 | ||
| Previous Owner | $1,170,750 | ||
| Previous Owner | $1,300,000 | ||
| Previous Owner | $400,000 |
We collect this data history from publicly available records. To have your information removed, we recommend requesting removal directly through your county’s website.
| Date | Event | Price | List to Sale | Price per Sq Ft | Prior Sale |
|---|---|---|---|---|---|
| 07/09/2025 07/09/25 | Sold | $2,685,000 | +5.3% | $879 / Sq Ft | |
| 05/22/2025 05/22/25 | Pending | -- | -- | -- | |
| 05/09/2025 05/09/25 | For Sale | $2,550,000 | +63.4% | $834 / Sq Ft | |
| 09/30/2022 09/30/22 | Sold | $1,561,000 | -2.4% | $495 / Sq Ft | View Prior Sale |
| 09/18/2022 09/18/22 | Off Market | $1,599,000 | -- | -- | |
| 08/10/2022 08/10/22 | Pending | -- | -- | -- | |
| 07/22/2022 07/22/22 | For Sale | $1,599,000 | +48.7% | $507 / Sq Ft | |
| 12/22/2021 12/22/21 | Sold | $1,075,000 | -6.5% | $352 / Sq Ft | View Prior Sale |
| 11/08/2021 11/08/21 | Pending | -- | -- | -- | |
| 10/31/2021 10/31/21 | For Sale | $1,150,000 | -- | $377 / Sq Ft |
We collect this data history from publicly available records. To have your information removed, we recommend requesting removal directly through your county’s website.
| Year | Tax Paid | Tax Assessment Tax Assessment Total Assessment is a certain percentage of the fair market value that is determined by local assessors to be the total taxable value of land and additions on the property. | Land | Improvement |
|---|---|---|---|---|
| 2025 | $6,220 | $1,792,400 | $487,500 | $1,304,900 |
| 2024 | $6,039 | $1,691,700 | $459,900 | $1,231,800 |
| 2023 | $4,414 | $1,137,500 | $383,200 | $754,300 |
| 2022 | $4,979 | $1,077,600 | $383,200 | $694,400 |
| 2021 | $4,670 | $937,800 | $348,300 | $589,500 |
| 2020 | $4,553 | $944,700 | $348,300 | $596,400 |
| 2019 | $4,507 | $929,200 | $325,600 | $603,600 |
| 2018 | $4,288 | $880,400 | $325,600 | $554,800 |
| 2017 | $4,333 | $861,400 | $316,100 | $545,300 |
| 2016 | $4,271 | $850,800 | $309,900 | $540,900 |
| 2015 | $4,155 | $832,600 | $301,200 | $531,400 |
| 2014 | $4,220 | $830,700 | $301,200 | $529,500 |
P
Seller's Agent in 2025
Pam Roberts
Gibson Sotheby's International Realty
(508) 432-6100
1 in this area
33 Total Sales
J
Buyer's Agent in 2025
Judith Smith
John C Ricotta & Assoc.
(508) 274-4100
7 in this area
34 Total Sales
M
Seller's Agent in 2022
Michael Masci
North Atlantic Realty Group
(774) 991-0906
1 in this area
20 Total Sales
E
Buyer's Agent in 2022
Ella Leavitt
Today Real Estate
Seller's Agent in 2021
Scott Zaino
Keller Williams Realty
(508) 566-0051
1 in this area
92 Total Sales
D
Buyer's Agent in 2021
Dennis Kerkado
North Atlantic Realty Group
(508) 577-7258
1 in this area
11 Total Sales
Source: Cape Cod & Islands Association of REALTORS®
MLS Number: 22502200
APN: CHAT-000006E-000033-K000012AM
Disclaimer: Certain information contained herein is derived from information provided by parties other than Homes.com. All information provided is deemed reliable, but is not guaranteed to be accurate and should be independently verified.
![]() All data relating to real estate for sale on this page comes from the Broker Reciprocity (BR) of the Cape Cod & Islands Multiple Listing Service, Inc. Detailed information about real estate listings held by brokerage firms other than CC&I Assoc. of REALTORS®, Inc. includes the name of the listing company. Neither the listing company nor CC&I Assoc. of REALTORS®, Inc. shall be responsible for any typographical errors, misinformation, misprints and shall be held totally harmless. The Broker providing this data believes it to be correct, but advises interested parties to confirm any item before relying on it in a purchase decision. All properties are subject to prior sale, changes, or withdrawal. Copyright 2026 © Cape Cod & Islands Multiple Listing Service, Inc. All rights reserved.
All data relating to real estate for sale on this page comes from the Broker Reciprocity (BR) of the Cape Cod & Islands Multiple Listing Service, Inc. Detailed information about real estate listings held by brokerage firms other than CC&I Assoc. of REALTORS®, Inc. includes the name of the listing company. Neither the listing company nor CC&I Assoc. of REALTORS®, Inc. shall be responsible for any typographical errors, misinformation, misprints and shall be held totally harmless. The Broker providing this data believes it to be correct, but advises interested parties to confirm any item before relying on it in a purchase decision. All properties are subject to prior sale, changes, or withdrawal. Copyright 2026 © Cape Cod & Islands Multiple Listing Service, Inc. All rights reserved.
Ask me questions while you tour the home.