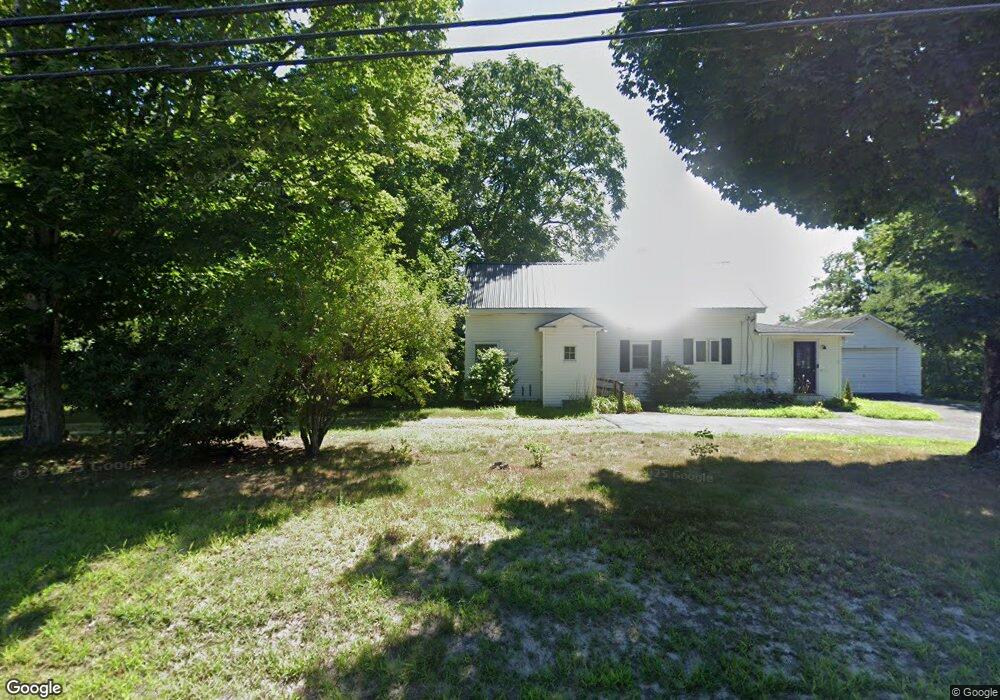
7 Cook Rd Windham, ME 04062
Estimated Value: $451,000 - $525,000
3
Beds
2
Baths
1,563
Sq Ft
$306/Sq Ft
Est. Value
About This Home
This home is located at 7 Cook Rd, Windham, ME 04062 and is currently estimated at $477,654, approximately $305 per square foot. 7 Cook Rd is a home located in Cumberland County with nearby schools including Windham Primary School, Manchester School, and Windham Middle School.
Ownership History
Date
Name
Owned For
Owner Type
Purchase Details
Closed on
Oct 27, 2025
Sold by
Mcdonald Jamie L
Bought by
Mcdonald Joshua D
Current Estimated Value
Home Financials for this Owner
Home Financials are based on the most recent Mortgage that was taken out on this home.
Original Mortgage
$170,000
Outstanding Balance
$169,590
Interest Rate
7.13%
Mortgage Type
Purchase Money Mortgage
Estimated Equity
$308,064
Purchase Details
Closed on
Apr 26, 2012
Sold by
Swan Payson
Bought by
Mcdonald Joshua D and Galipeau Jamie L
Home Financials for this Owner
Home Financials are based on the most recent Mortgage that was taken out on this home.
Original Mortgage
$197,825
Interest Rate
3.91%
Mortgage Type
FHA
Purchase Details
Closed on
Apr 22, 2009
Sold by
Tompson Development Inc
Bought by
Swan Payson
Home Financials for this Owner
Home Financials are based on the most recent Mortgage that was taken out on this home.
Original Mortgage
$177,040
Interest Rate
4.93%
Mortgage Type
FHA
Create a Home Valuation Report for This Property
The Home Valuation Report is an in-depth analysis detailing your home's value as well as a comparison with similar homes in the area
Home Values in the Area
Average Home Value in this Area
Purchase History
| Date | Buyer | Sale Price | Title Company |
|---|---|---|---|
| Mcdonald Joshua D | -- | -- | |
| Mcdonald Joshua D | -- | -- | |
| Mcdonald Joshua D | -- | -- | |
| Swan Payson | -- | -- |
Source: Public Records
Mortgage History
| Date | Status | Borrower | Loan Amount |
|---|---|---|---|
| Open | Mcdonald Joshua D | $170,000 | |
| Previous Owner | Mcdonald Joshua D | $197,825 | |
| Previous Owner | Swan Payson | $177,040 |
Source: Public Records
Tax History
| Year | Tax Paid | Tax Assessment Tax Assessment Total Assessment is a certain percentage of the fair market value that is determined by local assessors to be the total taxable value of land and additions on the property. | Land | Improvement |
|---|---|---|---|---|
| 2025 | $4,726 | $391,900 | $127,000 | $264,900 |
| 2024 | $4,495 | $391,900 | $127,000 | $264,900 |
| 2023 | $4,159 | $371,300 | $118,100 | $253,200 |
| 2022 | $3,838 | $330,600 | $105,300 | $225,300 |
| 2021 | $3,446 | $273,500 | $91,600 | $181,900 |
| 2020 | $3,582 | $238,800 | $80,400 | $158,400 |
| 2019 | $3,496 | $238,800 | $80,400 | $158,400 |
| 2018 | $3,323 | $218,900 | $72,300 | $146,600 |
| 2017 | $3,238 | $197,100 | $64,300 | $132,800 |
| 2016 | $3,094 | $197,100 | $64,300 | $132,800 |
| 2015 | $2,986 | $197,100 | $64,300 | $132,800 |
| 2014 | $2,891 | $197,100 | $64,300 | $132,800 |
| 2013 | -- | $197,100 | $64,300 | $132,800 |
Source: Public Records
Map
Nearby Homes
- 18 Cook Rd
- 8 Beaulieu Dr
- 594 River Rd
- 20 Revolution Dr
- 42 Barnes Rd
- 12 Dolley Farm Rd Unit 6
- 0 Meredith Dr
- 7 Magnolia Ln Unit 2
- 324 Roosevelt Trail
- 18 Victoria Ln
- 29 Victoria Ln
- 16 Davis Ave
- 30 Marshall Valley Rd
- 26 Marshall Valley Rd
- Lot 4 Highland Cliff Rd
- 81 Hall Rd
- 99 Land of Nod Rd
- 4 Patriot Dr
- 215 N Gorham Rd
- 53 Johnson Rd
Your Personal Tour Guide
Ask me questions while you tour the home.