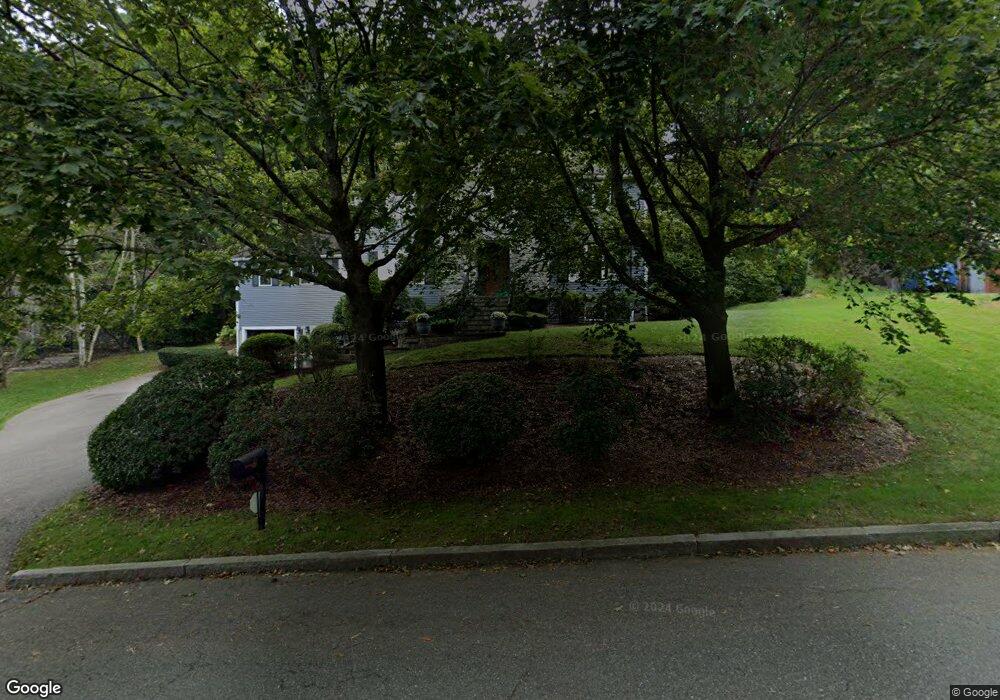
7 Coolidge Rd Winchester, MA 01890
West Side NeighborhoodEstimated Value: $1,803,000 - $1,983,000
4
Beds
3
Baths
2,851
Sq Ft
$667/Sq Ft
Est. Value
About This Home
This home is located at 7 Coolidge Rd, Winchester, MA 01890 and is currently estimated at $1,902,295, approximately $667 per square foot. 7 Coolidge Rd is a home located in Middlesex County with nearby schools including Vinson-Owen Elementary School, McCall Middle School, and Winchester High School.
Ownership History
Date
Name
Owned For
Owner Type
Purchase Details
Closed on
Jun 26, 2003
Sold by
Pacific Bryan W and Pacific Maria
Bought by
Eichel Steven P and Adelman Michele L
Current Estimated Value
Home Financials for this Owner
Home Financials are based on the most recent Mortgage that was taken out on this home.
Original Mortgage
$650,000
Interest Rate
5.53%
Mortgage Type
Purchase Money Mortgage
Purchase Details
Closed on
Apr 18, 2000
Sold by
Borenstein Ft
Bought by
Pacific Bryan W and Pacific Maria M
Create a Home Valuation Report for This Property
The Home Valuation Report is an in-depth analysis detailing your home's value as well as a comparison with similar homes in the area
Home Values in the Area
Average Home Value in this Area
Purchase History
| Date | Buyer | Sale Price | Title Company |
|---|---|---|---|
| Eichel Steven P | $915,000 | -- | |
| Pacific Bryan W | $635,000 | -- |
Source: Public Records
Mortgage History
| Date | Status | Borrower | Loan Amount |
|---|---|---|---|
| Open | Pacific Bryan W | $630,000 | |
| Closed | Eichel Steven P | $650,000 | |
| Previous Owner | Pacific Bryan W | $60,000 |
Source: Public Records
Tax History
| Year | Tax Paid | Tax Assessment Tax Assessment Total Assessment is a certain percentage of the fair market value that is determined by local assessors to be the total taxable value of land and additions on the property. | Land | Improvement |
|---|---|---|---|---|
| 2025 | $195 | $1,755,400 | $1,000,100 | $755,300 |
| 2024 | $18,332 | $1,618,000 | $920,100 | $697,900 |
| 2023 | $17,108 | $1,449,800 | $760,100 | $689,700 |
| 2022 | $17,129 | $1,369,200 | $700,100 | $669,100 |
| 2021 | $16,284 | $1,269,200 | $600,100 | $669,100 |
| 2020 | $15,725 | $1,269,200 | $600,100 | $669,100 |
| 2019 | $14,886 | $1,229,200 | $560,100 | $669,100 |
| 2018 | $5,244 | $1,165,000 | $515,100 | $649,900 |
| 2017 | $130 | $1,135,300 | $515,100 | $620,200 |
| 2016 | $13,034 | $1,115,900 | $515,100 | $600,800 |
| 2015 | $12,463 | $1,026,600 | $449,100 | $577,500 |
| 2014 | $12,657 | $999,800 | $430,100 | $569,700 |
Source: Public Records
Map
Nearby Homes
Your Personal Tour Guide
Ask me questions while you tour the home.