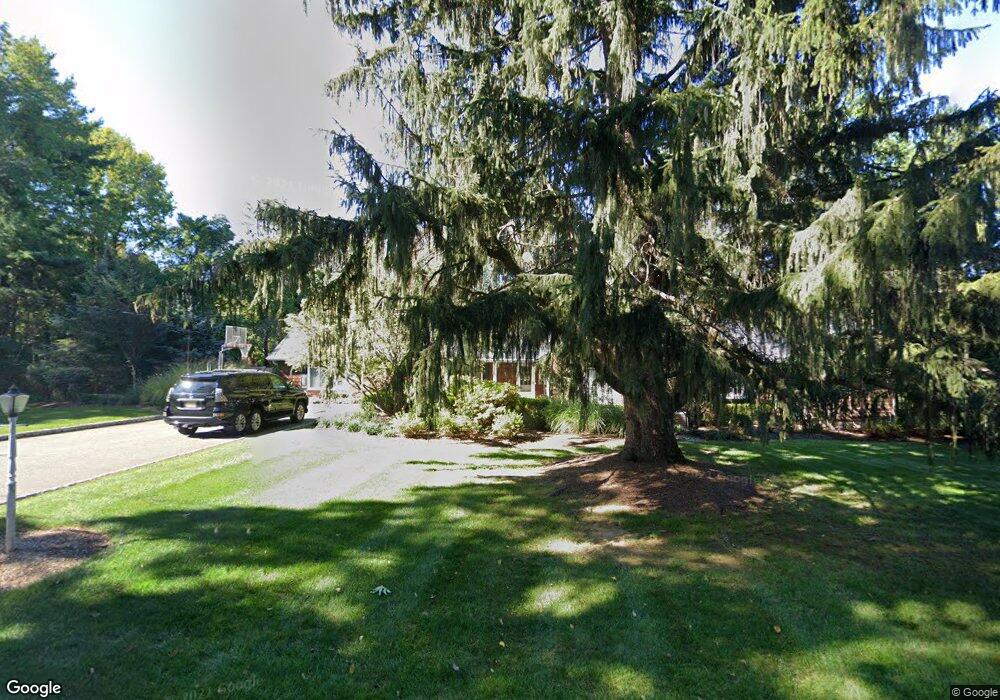
7 Corey Ln Mendham, NJ 07945
Estimated Value: $1,137,000 - $1,554,000
Studio
--
Bath
3,797
Sq Ft
$360/Sq Ft
Est. Value
About This Home
This home is located at 7 Corey Ln, Mendham, NJ 07945 and is currently estimated at $1,368,486, approximately $360 per square foot. 7 Corey Ln is a home located in Morris County with nearby schools including Mendham Township Elementary School, Mendham Township Middle School, and West Morris Mendham High School.
Ownership History
Date
Name
Owned For
Owner Type
Purchase Details
Closed on
May 19, 2004
Sold by
Davidson James
Bought by
Hassan George and Hassan Julia
Current Estimated Value
Home Financials for this Owner
Home Financials are based on the most recent Mortgage that was taken out on this home.
Original Mortgage
$333,000
Interest Rate
6.33%
Create a Home Valuation Report for This Property
The Home Valuation Report is an in-depth analysis detailing your home's value as well as a comparison with similar homes in the area
Home Values in the Area
Average Home Value in this Area
Purchase History
| Date | Buyer | Sale Price | Title Company |
|---|---|---|---|
| Hassan George | $850,000 | -- |
Source: Public Records
Mortgage History
| Date | Status | Borrower | Loan Amount |
|---|---|---|---|
| Previous Owner | Hassan George | $333,000 |
Source: Public Records
Tax History
| Year | Tax Paid | Tax Assessment Tax Assessment Total Assessment is a certain percentage of the fair market value that is determined by local assessors to be the total taxable value of land and additions on the property. | Land | Improvement |
|---|---|---|---|---|
| 2025 | $21,449 | $1,231,200 | $613,700 | $617,500 |
| 2024 | $20,852 | $1,104,500 | $531,400 | $573,100 |
Source: Public Records
Map
Nearby Homes
- 6 Thackery Ln
- 13 Knollwood Trail E
- 17 E Main St
- 41 Franklin Rd
- 5 Exmoor Dr
- 1 Southern Slope Terrace
- 67 Hampshire Dr
- 3 Exmoor Dr
- 7 Exmoor Dr
- 26 Woodland Rd
- 6 Cold Hill Rd
- 16 Galway Dr
- 89 Talmage Rd
- 465 Cherry Ln
- 22 Talmage Rd
- 160 Jockey Hollow Rd
- 3 Old Orchard Terrace
- 39 Woodland Rd
- 3 Preserve Ln
- 54 Hardscrabble Rd
Your Personal Tour Guide
Ask me questions while you tour the home.