Estimated Value: $232,987 - $261,000
--
Bed
4
Baths
2,337
Sq Ft
$106/Sq Ft
Est. Value
About This Home
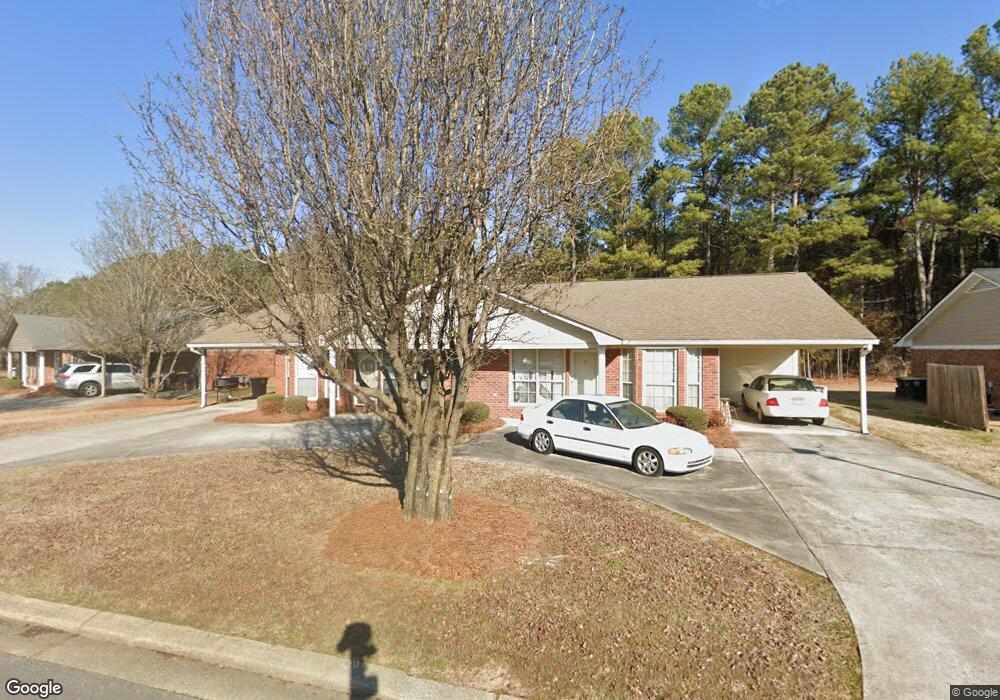
This home is located at 7 Cornerstone Dr NW Unit 5, Rome, GA 30165 and is currently estimated at $248,247, approximately $106 per square foot. 7 Cornerstone Dr NW Unit 5 is a home located in Floyd County with nearby schools including Rome High School.
Ownership History
Date
Name
Owned For
Owner Type
Purchase Details
Closed on
Apr 13, 2007
Sold by
Not Provided
Bought by
Gordon Rachel W and Gordon Jason R
Current Estimated Value
Home Financials for this Owner
Home Financials are based on the most recent Mortgage that was taken out on this home.
Original Mortgage
$132,442
Outstanding Balance
$79,858
Interest Rate
6.1%
Mortgage Type
New Conventional
Estimated Equity
$168,390
Purchase Details
Closed on
Apr 15, 2004
Sold by
Epperson Bruce
Bought by
Banone Properties Inc
Purchase Details
Closed on
Mar 28, 2003
Sold by
Epperson Bruce and Epperson Karen R
Bought by
Epperson Bruce
Purchase Details
Closed on
Mar 27, 2002
Bought by
P and R
Purchase Details
Closed on
Mar 6, 2002
Sold by
Epperson Bruce
Bought by
Epperson Bruce and Epperson Karen R
Purchase Details
Closed on
Feb 21, 2002
Sold by
Garden Lakes Company The
Bought by
Lakes Construction Company Inc
Purchase Details
Closed on
Oct 17, 1983
Bought by
Garden Lakes Company The
Create a Home Valuation Report for This Property
The Home Valuation Report is an in-depth analysis detailing your home's value as well as a comparison with similar homes in the area
Home Values in the Area
Average Home Value in this Area
Purchase History
| Date | Buyer | Sale Price | Title Company |
|---|---|---|---|
| Gordon Rachel W | $149,000 | -- | |
| Banone Properties Inc | -- | -- | |
| Epperson Bruce | -- | -- | |
| P | -- | -- | |
| Epperson Bruce | -- | -- | |
| Epperson Bruce | $133,800 | -- | |
| Lakes Construction Company Inc | $23,900 | -- | |
| Garden Lakes Company The | -- | -- |
Source: Public Records
Mortgage History
| Date | Status | Borrower | Loan Amount |
|---|---|---|---|
| Open | Gordon Rachel W | $132,442 |
Source: Public Records
Tax History Compared to Growth
Tax History
| Year | Tax Paid | Tax Assessment Tax Assessment Total Assessment is a certain percentage of the fair market value that is determined by local assessors to be the total taxable value of land and additions on the property. | Land | Improvement |
|---|---|---|---|---|
| 2024 | $3,751 | $73,200 | $18,346 | $54,854 |
| 2023 | $2,592 | $73,200 | $18,346 | $54,854 |
| 2022 | $2,475 | $79,800 | $20,000 | $59,800 |
| 2021 | $2,271 | $61,210 | $10,000 | $51,210 |
| 2020 | $2,197 | $58,706 | $10,000 | $48,706 |
| 2019 | $2,079 | $56,153 | $10,000 | $46,153 |
| 2018 | $1,894 | $51,175 | $10,000 | $41,175 |
| 2017 | $1,848 | $49,903 | $10,000 | $39,903 |
| 2016 | $1,829 | $49,251 | $10,000 | $39,251 |
| 2015 | $1,727 | $49,251 | $10,000 | $39,251 |
| 2014 | $1,727 | $49,251 | $10,000 | $39,251 |
Source: Public Records
Map
Nearby Homes
- 233 Longmeadow Dr NW
- 38 Boulder Dr NW
- 320 Elliott Dr NW
- 1 Lindsey Terrace NW
- 104 Morgan Dr NW
- 13 Crosscreek Dr NW
- 1 Addington Ct NW Unit B
- 103 Bent Creek Dr NW
- 2614 Garden Lakes Blvd NW
- 11 Pinestream Dr NW
- 2602 Lakeridge Cir NW
- 25 Shoreline Dr NW
- 33 NW Hunters Glenn Rd
- 3013 Garden Lakes Blvd NW
- 135 Benton Dr NW
- 123 Trentwood Place NW
- 23 Westwillow Ln NW
- 9 Prescott Ln NW
- 32 Donley Dr NW
- 9 Cornerstone Dr NW
- 3 Cornerstone Dr NW Unit 1
- 13 Cornerstone Dr NW
- 1315 Cornerstone Dr NW
- 1012 Cornerstone Dr NW
- 17 Cornerstone Dr NW
- 3 Sandcreek Dr NW
- 6 Sandcreek Dr NW
- 10-12 Pebblecreek Dr
- 6 Sandcreek Dr NW
- 17-19 Pebblecreek Dr
- 21 Cornerstone Dr NW
- 369 Rockcreek Dr NW
- 5 Sandcreek Dr NW
- 25 Cornerstone Dr NW
- 6 Rockcreek Dr NW
- 6 Rockcreek Dr NW
- 9 Sandcreek Dr NW
- 29 Cornerstone Dr NW
- 14 Sandcreek Dr NW