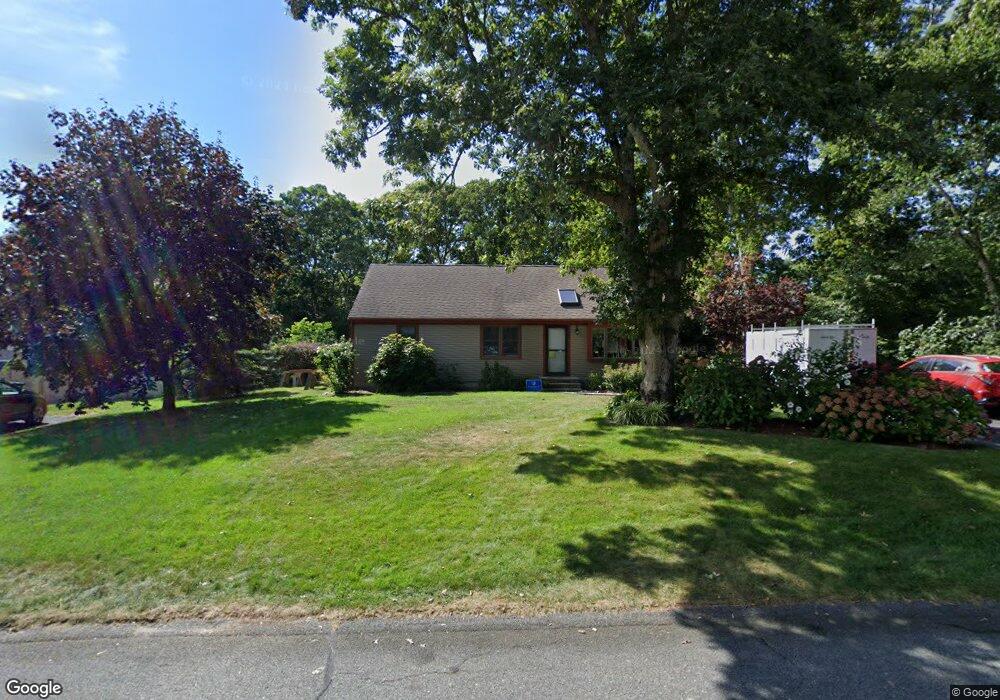
7 Covey Dr Yarmouth Port, MA 02675
Yarmouth Port NeighborhoodEstimated Value: $589,000 - $727,000
3
Beds
2
Baths
1,001
Sq Ft
$641/Sq Ft
Est. Value
About This Home
This home is located at 7 Covey Dr, Yarmouth Port, MA 02675 and is currently estimated at $641,265, approximately $640 per square foot. 7 Covey Dr is a home located in Barnstable County with nearby schools including Dennis-Yarmouth Regional High School and St. Pius X. School.
Ownership History
Date
Name
Owned For
Owner Type
Purchase Details
Closed on
Jul 2, 2025
Sold by
Soderberg Dana J and Soderberg Leann E
Bought by
2025 Soderberg Ft and Soderberg
Current Estimated Value
Purchase Details
Closed on
Feb 15, 1995
Sold by
Salo Barry F and Salo Virginia M
Bought by
Soderberg Dana J and Soderberg Leann E
Create a Home Valuation Report for This Property
The Home Valuation Report is an in-depth analysis detailing your home's value as well as a comparison with similar homes in the area
Home Values in the Area
Average Home Value in this Area
Purchase History
| Date | Buyer | Sale Price | Title Company |
|---|---|---|---|
| 2025 Soderberg Ft | -- | -- | |
| 2025 Soderberg Ft | -- | -- | |
| Soderberg Dana J | $95,000 | -- | |
| Soderberg Dana J | $95,000 | -- |
Source: Public Records
Mortgage History
| Date | Status | Borrower | Loan Amount |
|---|---|---|---|
| Previous Owner | Soderberg Dana J | $170,000 | |
| Previous Owner | Soderberg Dana J | $35,000 | |
| Previous Owner | Soderberg Dana J | $137,000 |
Source: Public Records
Tax History Compared to Growth
Tax History
| Year | Tax Paid | Tax Assessment Tax Assessment Total Assessment is a certain percentage of the fair market value that is determined by local assessors to be the total taxable value of land and additions on the property. | Land | Improvement |
|---|---|---|---|---|
| 2025 | $3,748 | $529,400 | $167,300 | $362,100 |
| 2024 | $3,530 | $478,300 | $145,500 | $332,800 |
| 2023 | $3,451 | $425,500 | $132,300 | $293,200 |
| 2022 | $3,304 | $359,900 | $126,200 | $233,700 |
| 2021 | $3,102 | $324,500 | $126,200 | $198,300 |
| 2020 | $3,106 | $310,600 | $133,500 | $177,100 |
| 2019 | $2,880 | $285,100 | $133,500 | $151,600 |
| 2018 | $2,704 | $262,800 | $111,200 | $151,600 |
| 2017 | $2,633 | $262,800 | $111,200 | $151,600 |
| 2016 | $2,534 | $253,900 | $102,300 | $151,600 |
| 2015 | $2,351 | $234,200 | $97,900 | $136,300 |
Source: Public Records
Map
Nearby Homes
- 13 Covey Dr
- 111 Merchant Ave
- 4 Ebb Rd
- 6 Nimble Hill Dr
- 153 Bayridge Dr
- 11 Uncle Stanleys Way
- 26 Olivia Walker Way
- 59 Main St Unit 19-2
- 59 Route 6a Unit 29-4
- 118 Driftwood Ln
- 15 Captain Jud Rd
- 129 Driftwood Ln
- 44 Stratford Ln
- 17 Margate Ln
- 268 Main St
- 51 Bray Farm Rd N
- 86 Pompano Rd
- 4 Old Colony Way
- 64 Kates Path
- 3 Covey Dr
- 218 Setucket Rd
- 8 Covey Dr
- 14 Covey Dr
- 1 Uncle Jimmy's Ln
- 19 Covey Dr
- 210 Setucket Rd
- 11 Uncle Jimmy's Ln
- 238 Setucket Rd
- 6 Thrush Trail
- 23 Covey Dr
- 1 Uncle Jimmys Ln
- 233 Setucket Rd
- 219 Setucket Rd
- 204 Setucket Rd
- 24 Covey Dr
- 244 Setucket Rd
- 10 Thrush Trail
- 243 Setucket Rd
- 1 Aunt Dorahs Ln