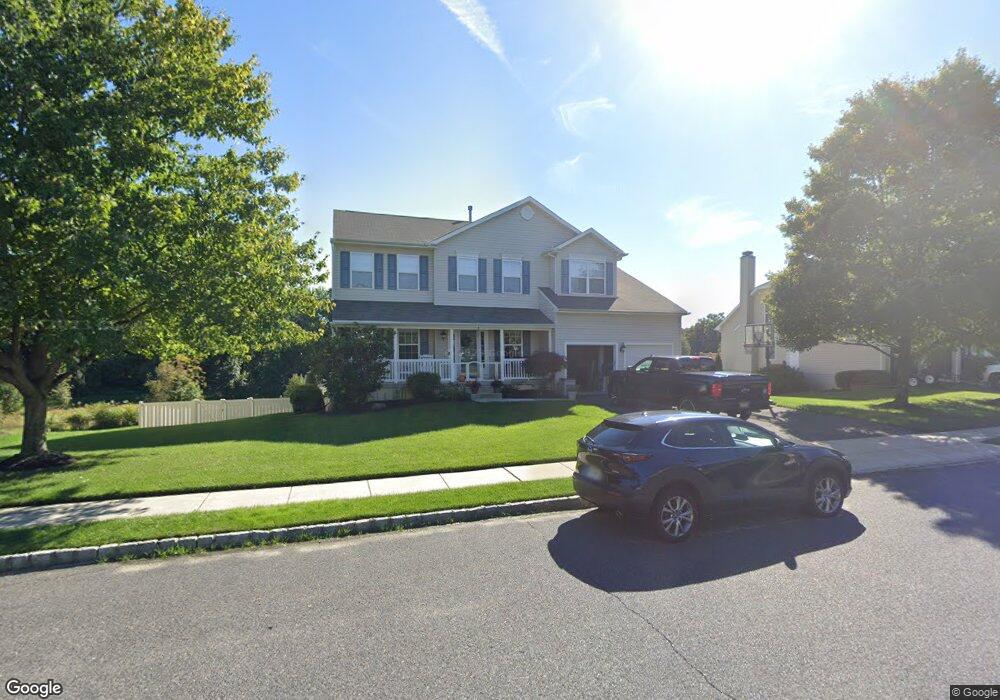
7 Cox Farm Rd Burlington, NJ 08016
Estimated Value: $534,692 - $645,000
--
Bed
--
Bath
2,380
Sq Ft
$253/Sq Ft
Est. Value
About This Home
This home is located at 7 Cox Farm Rd, Burlington, NJ 08016 and is currently estimated at $603,173, approximately $253 per square foot. 7 Cox Farm Rd is a home located in Burlington County with nearby schools including B Bernice Young Elementary School, Fountain Woods Elementary School, and Burlington Township Middle School at Springside.
Ownership History
Date
Name
Owned For
Owner Type
Purchase Details
Closed on
Sep 13, 2024
Sold by
Winkler Michele and Lehenaff Michael A
Bought by
Lehenaff and Lehenaff Family Trust
Current Estimated Value
Purchase Details
Closed on
May 10, 2002
Sold by
Bruce Paparone Inc
Bought by
Lehenaff Michael A and Winkler Michele
Home Financials for this Owner
Home Financials are based on the most recent Mortgage that was taken out on this home.
Original Mortgage
$25,100
Interest Rate
6.47%
Mortgage Type
Stand Alone Second
Create a Home Valuation Report for This Property
The Home Valuation Report is an in-depth analysis detailing your home's value as well as a comparison with similar homes in the area
Home Values in the Area
Average Home Value in this Area
Purchase History
| Date | Buyer | Sale Price | Title Company |
|---|---|---|---|
| Lehenaff | -- | None Listed On Document | |
| Lehenaff | -- | None Listed On Document | |
| Lehenaff Michael A | $251,100 | American Title Abstract Corp |
Source: Public Records
Mortgage History
| Date | Status | Borrower | Loan Amount |
|---|---|---|---|
| Previous Owner | Lehenaff Michael A | $25,100 | |
| Previous Owner | Lehenaff Michael A | $200,800 |
Source: Public Records
Tax History Compared to Growth
Tax History
| Year | Tax Paid | Tax Assessment Tax Assessment Total Assessment is a certain percentage of the fair market value that is determined by local assessors to be the total taxable value of land and additions on the property. | Land | Improvement |
|---|---|---|---|---|
| 2025 | $11,318 | $373,300 | $105,600 | $267,700 |
| 2024 | $11,150 | $373,300 | $105,600 | $267,700 |
| 2023 | $11,150 | $373,300 | $105,600 | $267,700 |
| 2022 | $11,102 | $373,300 | $105,600 | $267,700 |
| 2021 | $11,214 | $373,300 | $105,600 | $267,700 |
| 2020 | $11,188 | $373,300 | $105,600 | $267,700 |
| 2019 | $11,214 | $373,300 | $105,600 | $267,700 |
| 2018 | $11,046 | $373,300 | $105,600 | $267,700 |
| 2017 | $10,979 | $373,300 | $105,600 | $267,700 |
| 2016 | $9,996 | $333,200 | $114,900 | $218,300 |
| 2015 | $9,823 | $333,200 | $114,900 | $218,300 |
| 2014 | $9,463 | $333,200 | $114,900 | $218,300 |
Source: Public Records
Map
Nearby Homes