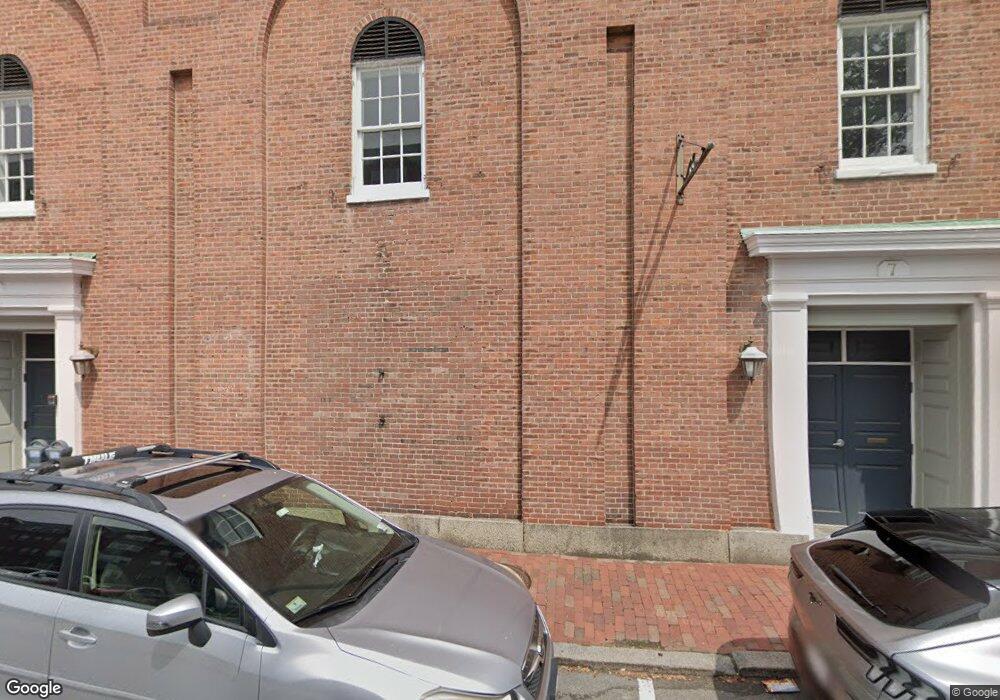
7 Crombie St Salem, MA 01970
Downtown Salem NeighborhoodEstimated Value: $300,000 - $422,000
1
Bed
2
Baths
13,000
Sq Ft
$28/Sq Ft
Est. Value
About This Home
This home is located at 7 Crombie St, Salem, MA 01970 and is currently estimated at $367,732, approximately $28 per square foot. 7 Crombie St is a home located in Essex County with nearby schools including Saltonstall School, Carlton Elementary School, and Bates Elementary School.
Ownership History
Date
Name
Owned For
Owner Type
Purchase Details
Closed on
Dec 6, 2023
Sold by
Almeida Christine
Bought by
Almeida Christine and Dealmeida Emerson C
Current Estimated Value
Purchase Details
Closed on
Jun 15, 2011
Sold by
Fnma
Bought by
Trull Bradford B
Home Financials for this Owner
Home Financials are based on the most recent Mortgage that was taken out on this home.
Original Mortgage
$113,310
Interest Rate
4.74%
Mortgage Type
Purchase Money Mortgage
Purchase Details
Closed on
Dec 1, 2010
Sold by
Vlachos Michael
Bought by
Ready Holly and Jordan Kevin
Purchase Details
Closed on
Jul 19, 2006
Sold by
Bluestone Alley Llc and Meche
Bought by
Vlachos Michael and Vlachos Patricia
Purchase Details
Closed on
Aug 8, 2005
Sold by
Crombie St Cong Chrch
Bought by
Blue Stone Alley Llc
Create a Home Valuation Report for This Property
The Home Valuation Report is an in-depth analysis detailing your home's value as well as a comparison with similar homes in the area
Home Values in the Area
Average Home Value in this Area
Purchase History
| Date | Buyer | Sale Price | Title Company |
|---|---|---|---|
| Almeida Christine | -- | None Available | |
| Trull Bradford B | $125,900 | -- | |
| Ready Holly | $160,000 | -- | |
| Vlachos Michael | $249,000 | -- | |
| Blue Stone Alley Llc | $790,000 | -- |
Source: Public Records
Mortgage History
| Date | Status | Borrower | Loan Amount |
|---|---|---|---|
| Previous Owner | Blue Stone Alley Llc | $113,310 |
Source: Public Records
Tax History Compared to Growth
Tax History
| Year | Tax Paid | Tax Assessment Tax Assessment Total Assessment is a certain percentage of the fair market value that is determined by local assessors to be the total taxable value of land and additions on the property. | Land | Improvement |
|---|---|---|---|---|
| 2025 | $4,412 | $389,100 | $0 | $389,100 |
| 2024 | $4,204 | $361,800 | $0 | $361,800 |
| 2023 | $4,275 | $341,700 | $0 | $341,700 |
| 2022 | $4,260 | $321,500 | $0 | $321,500 |
| 2021 | $4,024 | $291,600 | $0 | $291,600 |
| 2020 | $3,880 | $268,500 | $0 | $268,500 |
| 2019 | $3,832 | $253,800 | $0 | $253,800 |
| 2018 | $3,787 | $246,200 | $0 | $246,200 |
| 2017 | $3,624 | $228,500 | $0 | $228,500 |
| 2016 | $2,871 | $183,200 | $0 | $183,200 |
| 2015 | $2,655 | $161,800 | $0 | $161,800 |
Source: Public Records
Map
Nearby Homes
- 289 Essex St Unit 307
- 11 Summer St
- 140 Washington St Unit 1C
- 304 Essex St Unit 1
- 15 Lynde St Unit 26
- 47 Federal St
- 78 Federal St
- 20 Central St Unit 402
- 0 Lot 41 Map 10 Unit 73335079
- 0 Lot 61 Map 10 Unit 73335091
- 57 Endicott St Unit 2
- 38 Chestnut St
- 3 S Mason St
- 288-292 Washington & 5 Porter St Ct
- 145 Federal St Unit 3
- 35 Flint St Unit 209
- 35 Flint St Unit 106
- 39 1/2 Harbor St Unit 1
- 8 Williams St Unit 2
- 18 Franklin St Unit 303
- 7 Crombie St Unit 17
- 7 Crombie St Unit 15
- 7 Crombie St Unit 14
- 7 Crombie St Unit 12
- 7 Crombie St Unit 11
- 7 Crombie St Unit 10
- 7 Crombie St Unit 9
- 7 Crombie St Unit 8
- 7 Crombie St Unit 6
- 7 Crombie St Unit 5
- 7 Crombie St Unit 4
- 7 Crombie St Unit 3
- 7 Crombie St Unit 2
- 7 Crombie St Unit 1
- 7 Crombie St Unit 7
- 13 Barton Square Unit 2
- 9 Crombie St
- 281 Essex St Unit C-1
- 281 Essex St Unit C-3
- 281 Essex St Unit c1,2,3*