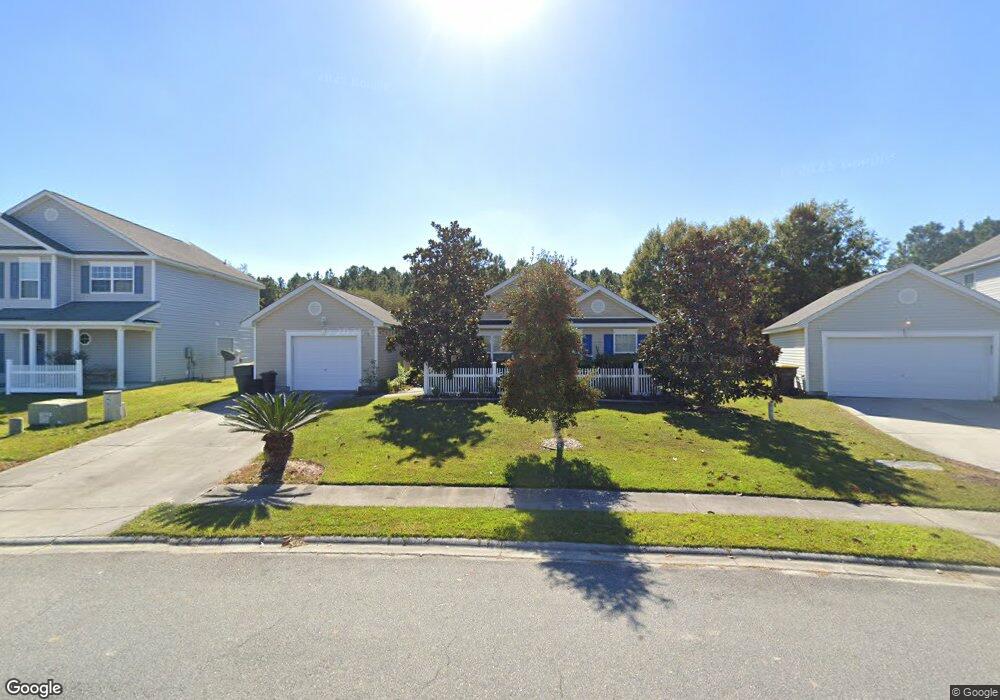
7 Cromer St Pooler, GA 31322
Godley Station NeighborhoodEstimated Value: $291,577 - $304,000
3
Beds
2
Baths
1,400
Sq Ft
$213/Sq Ft
Est. Value
About This Home
This home is located at 7 Cromer St, Pooler, GA 31322 and is currently estimated at $297,894, approximately $212 per square foot. 7 Cromer St is a home located in Chatham County with nearby schools including Godley Station School, Groves High School, and Savannah Adventist Christian School.
Ownership History
Date
Name
Owned For
Owner Type
Purchase Details
Closed on
Jul 31, 2025
Sold by
Rice Jennifer
Bought by
Hinson Pierce W
Current Estimated Value
Home Financials for this Owner
Home Financials are based on the most recent Mortgage that was taken out on this home.
Original Mortgage
$234,000
Outstanding Balance
$233,383
Interest Rate
6.67%
Mortgage Type
New Conventional
Estimated Equity
$64,511
Purchase Details
Closed on
May 23, 2022
Sold by
Bwt Investments Llc
Bought by
Rice Jennifer
Home Financials for this Owner
Home Financials are based on the most recent Mortgage that was taken out on this home.
Original Mortgage
$247,000
Interest Rate
5.11%
Mortgage Type
New Conventional
Purchase Details
Closed on
Aug 2, 2019
Sold by
Towns Benjamin W
Bought by
Bwt Investments Llc
Home Financials for this Owner
Home Financials are based on the most recent Mortgage that was taken out on this home.
Original Mortgage
$139,470
Interest Rate
3.7%
Mortgage Type
Commercial
Purchase Details
Closed on
May 11, 2007
Sold by
Not Provided
Bought by
Towns Benjamin W
Home Financials for this Owner
Home Financials are based on the most recent Mortgage that was taken out on this home.
Original Mortgage
$133,250
Interest Rate
5.88%
Mortgage Type
New Conventional
Create a Home Valuation Report for This Property
The Home Valuation Report is an in-depth analysis detailing your home's value as well as a comparison with similar homes in the area
Home Values in the Area
Average Home Value in this Area
Purchase History
| Date | Buyer | Sale Price | Title Company |
|---|---|---|---|
| Hinson Pierce W | $299,000 | -- | |
| Hinson Pierce W | $299,000 | -- | |
| Rice Jennifer | $260,000 | -- | |
| Rice Jennifer | $260,000 | -- | |
| Bwt Investments Llc | -- | -- | |
| Bwt Investments Llc | -- | -- | |
| Towns Benjamin W | $166,600 | -- | |
| Towns Benjamin W | $166,600 | -- | |
| Towns Benjamin W | $166,600 | -- | |
| Towns Benjamin W | $166,600 | -- |
Source: Public Records
Mortgage History
| Date | Status | Borrower | Loan Amount |
|---|---|---|---|
| Open | Hinson Pierce W | $234,000 | |
| Previous Owner | Rice Jennifer | $247,000 | |
| Previous Owner | Bwt Investments Llc | $139,470 | |
| Previous Owner | Towns Benjamin W | $133,250 |
Source: Public Records
Tax History Compared to Growth
Tax History
| Year | Tax Paid | Tax Assessment Tax Assessment Total Assessment is a certain percentage of the fair market value that is determined by local assessors to be the total taxable value of land and additions on the property. | Land | Improvement |
|---|---|---|---|---|
| 2025 | $2,819 | $90,640 | $22,000 | $68,640 |
| 2024 | $2,819 | $90,080 | $22,000 | $68,080 |
| 2023 | $1,009 | $82,720 | $17,200 | $65,520 |
| 2022 | $932 | $76,400 | $17,200 | $59,200 |
| 2021 | $2,851 | $65,640 | $15,200 | $50,440 |
| 2020 | $1,874 | $64,640 | $15,200 | $49,440 |
| 2019 | $2,637 | $59,360 | $15,200 | $44,160 |
| 2018 | $2,371 | $57,640 | $15,200 | $42,440 |
| 2017 | $2,150 | $56,720 | $14,000 | $42,720 |
| 2016 | $1,442 | $56,120 | $14,000 | $42,120 |
| 2015 | $2,160 | $56,640 | $14,000 | $42,640 |
| 2014 | $2,879 | $57,600 | $0 | $0 |
Source: Public Records
Map
Nearby Homes
- 105 Ballasalla Loop
- 274 Cromer St
- 237 Cromer St
- 236 Cromer St
- 252 Cromer St
- 279 Cromer St
- 148 Orkney Rd
- 116 Alexander Trail
- 283 Cromer St
- 11 Shoefstall St
- 16 Brookhaven Dr
- 7 Bridlington Way
- 4 Bridlington Way
- 176 Orkney Rd
- 105 Grimsby Rd
- 175 Orkney Rd
- 193 Orkney Rd
- 195 Orkney Rd
- 191 Orkney Rd
- 213 Orkney Rd