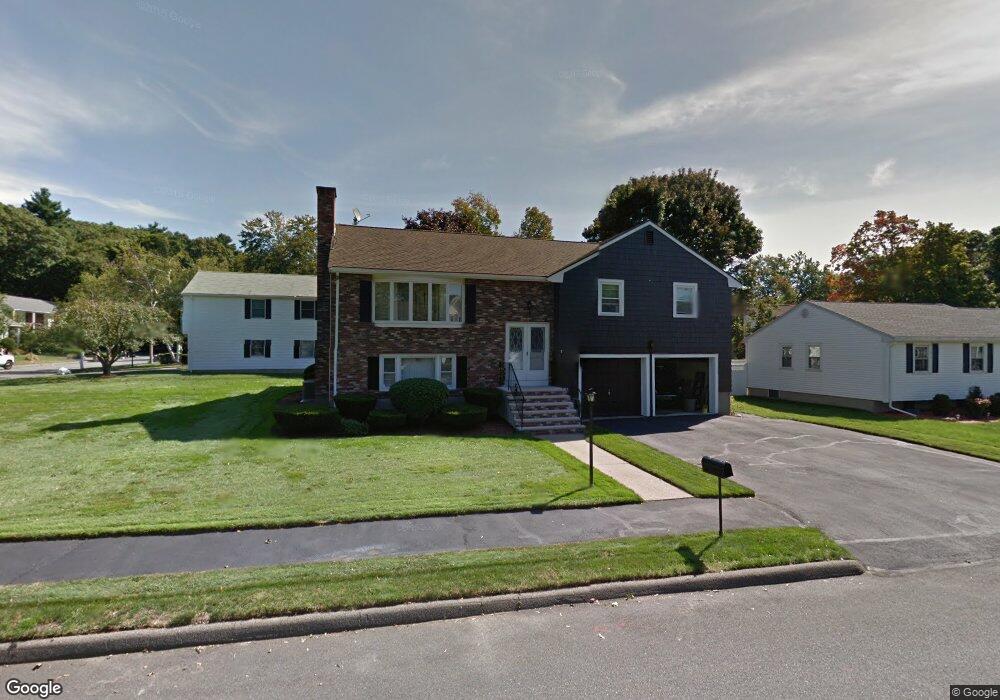
7 Crystal Dr Stoneham, MA 02180
Colonial Park NeighborhoodEstimated Value: $966,173 - $1,025,000
3
Beds
3
Baths
2,288
Sq Ft
$431/Sq Ft
Est. Value
About This Home
This home is located at 7 Crystal Dr, Stoneham, MA 02180 and is currently estimated at $985,043, approximately $430 per square foot. 7 Crystal Dr is a home located in Middlesex County with nearby schools including Stoneham High School, St. Patrick Elementary School, and Greater Boston Academy.
Ownership History
Date
Name
Owned For
Owner Type
Purchase Details
Closed on
Oct 9, 1987
Sold by
Bongiorno John D
Bought by
Scali Richard A
Current Estimated Value
Home Financials for this Owner
Home Financials are based on the most recent Mortgage that was taken out on this home.
Original Mortgage
$150,000
Interest Rate
10.33%
Mortgage Type
Purchase Money Mortgage
Create a Home Valuation Report for This Property
The Home Valuation Report is an in-depth analysis detailing your home's value as well as a comparison with similar homes in the area
Home Values in the Area
Average Home Value in this Area
Purchase History
| Date | Buyer | Sale Price | Title Company |
|---|---|---|---|
| Scali Richard A | $280,000 | -- |
Source: Public Records
Mortgage History
| Date | Status | Borrower | Loan Amount |
|---|---|---|---|
| Open | Scali Richard A | $25,000 | |
| Closed | Scali Richard A | $80,000 | |
| Closed | Scali Richard A | $150,000 |
Source: Public Records
Tax History
| Year | Tax Paid | Tax Assessment Tax Assessment Total Assessment is a certain percentage of the fair market value that is determined by local assessors to be the total taxable value of land and additions on the property. | Land | Improvement |
|---|---|---|---|---|
| 2025 | $8,771 | $857,400 | $420,100 | $437,300 |
| 2024 | $8,533 | $805,800 | $400,100 | $405,700 |
| 2023 | $8,204 | $739,100 | $360,100 | $379,000 |
| 2022 | $7,227 | $694,200 | $340,100 | $354,100 |
| 2021 | $6,845 | $632,600 | $300,100 | $332,500 |
| 2020 | $6,868 | $636,500 | $300,100 | $336,400 |
| 2019 | $6,812 | $607,100 | $270,100 | $337,000 |
| 2018 | $6,658 | $568,600 | $260,100 | $308,500 |
| 2017 | $6,471 | $522,300 | $230,100 | $292,200 |
| 2016 | $6,287 | $495,000 | $230,100 | $264,900 |
| 2015 | $6,431 | $496,200 | $230,100 | $266,100 |
| 2014 | $6,300 | $467,000 | $220,100 | $246,900 |
Source: Public Records
Map
Nearby Homes
- 9 Lovis Ave
- 12 Lovis Ave
- 3 Veterans Ln
- 15 Brookbridge Rd
- 15 Hickory Hill Rd
- 824 Main St Unit 1
- 39 Tamarock Terrace
- 81 Spring St
- 33 Lake Ave
- 24 Gladstone St
- 1 Sidney St
- 104 Myrtle Ave
- 17 Franklin St
- 58 Washington St
- 159 Franklin St Unit D2
- 159 Franklin St Unit C2
- 159 Franklin St Unit E6
- 55 Bartley St
- 137 Franklin St Unit 102
- 6 Sherman Rd
Your Personal Tour Guide
Ask me questions while you tour the home.