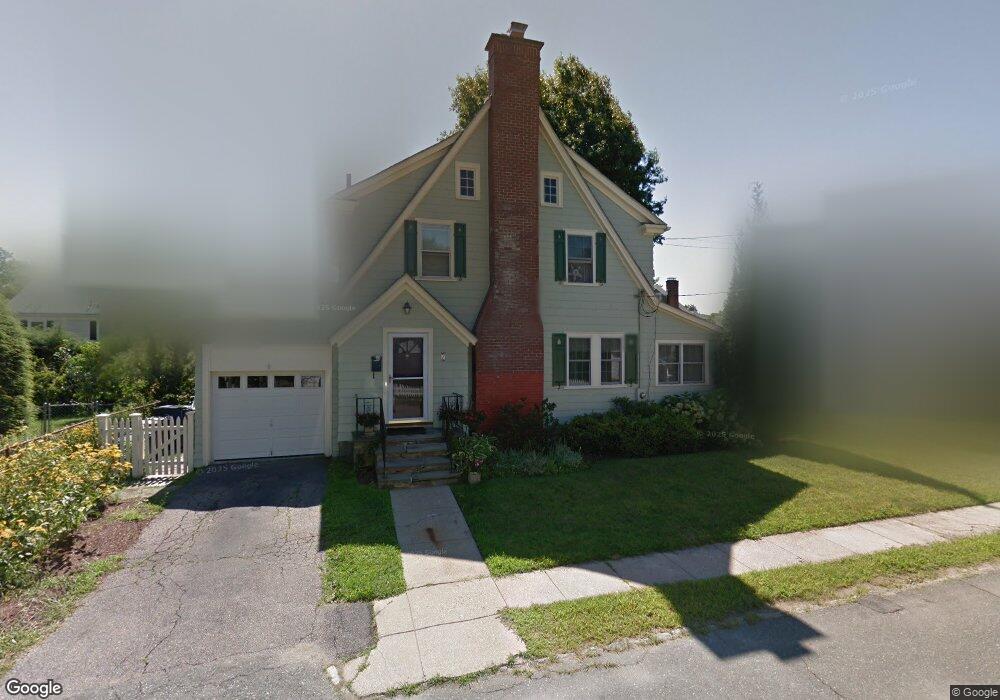
7 Cuthbert Rd West Roxbury, MA 02132
Bellevue Hill NeighborhoodEstimated Value: $875,750 - $1,083,000
3
Beds
2
Baths
99,999
Sq Ft
$10/Sq Ft
Est. Value
About This Home
This home is located at 7 Cuthbert Rd, West Roxbury, MA 02132 and is currently estimated at $996,438, approximately $9 per square foot. 7 Cuthbert Rd is a home located in Suffolk County with nearby schools including St Theresa School, Holy Name Parish School, and The Roxbury Latin School.
Ownership History
Date
Name
Owned For
Owner Type
Purchase Details
Closed on
Jun 1, 2015
Sold by
Chambers Brian and Weir Suzanne P
Bought by
Baril Arthur N and Howard Katherine K
Current Estimated Value
Home Financials for this Owner
Home Financials are based on the most recent Mortgage that was taken out on this home.
Original Mortgage
$415,000
Interest Rate
3.65%
Mortgage Type
New Conventional
Purchase Details
Closed on
Jun 2, 1999
Sold by
Travers Mary K Est
Bought by
Mcnulty Paul A and Mcnulty Janet A
Home Financials for this Owner
Home Financials are based on the most recent Mortgage that was taken out on this home.
Original Mortgage
$170,000
Interest Rate
6.85%
Mortgage Type
Purchase Money Mortgage
Create a Home Valuation Report for This Property
The Home Valuation Report is an in-depth analysis detailing your home's value as well as a comparison with similar homes in the area
Home Values in the Area
Average Home Value in this Area
Purchase History
| Date | Buyer | Sale Price | Title Company |
|---|---|---|---|
| Baril Arthur N | $569,500 | -- | |
| Mcnulty Paul A | $250,000 | -- |
Source: Public Records
Mortgage History
| Date | Status | Borrower | Loan Amount |
|---|---|---|---|
| Closed | Baril Arthur N | $415,000 | |
| Previous Owner | Mcnulty Paul A | $170,000 |
Source: Public Records
Tax History
| Year | Tax Paid | Tax Assessment Tax Assessment Total Assessment is a certain percentage of the fair market value that is determined by local assessors to be the total taxable value of land and additions on the property. | Land | Improvement |
|---|---|---|---|---|
| 2025 | $9,785 | $845,000 | $307,400 | $537,600 |
| 2024 | $8,441 | $774,400 | $293,400 | $481,000 |
| 2023 | $7,847 | $730,600 | $276,800 | $453,800 |
| 2022 | $7,225 | $664,100 | $251,600 | $412,500 |
| 2021 | $6,705 | $628,400 | $244,300 | $384,100 |
| 2020 | $6,355 | $601,800 | $225,800 | $376,000 |
| 2019 | $5,927 | $562,300 | $187,500 | $374,800 |
| 2018 | $5,610 | $535,300 | $187,500 | $347,800 |
| 2017 | $5,611 | $529,800 | $187,500 | $342,300 |
| 2016 | $5,498 | $499,800 | $187,500 | $312,300 |
| 2015 | $5,542 | $457,600 | $162,000 | $295,600 |
| 2014 | -- | $427,300 | $162,000 | $265,300 |
Source: Public Records
Map
Nearby Homes
- 73 Woodard Rd
- 205 Park St Unit 2
- 37 Pelton St
- 78 Howitt Rd
- 348 Lagrange St
- 425 Lagrange St Unit 203
- 4 Anawan Ave Unit 7
- 17 Hastings St Unit 5
- 24 Rhoda St
- 37 Hastings St Unit 201
- 150 Tyndale St Unit 2
- 281 Belgrade Ave Unit 2
- 35 Heron St
- 12 Leniston St
- 118-120 Tyndale St
- 17 Starling St
- 16 Starling St
- 2231 Centre St
- 32 Russett Rd
- 55 Redlands Rd
Your Personal Tour Guide
Ask me questions while you tour the home.