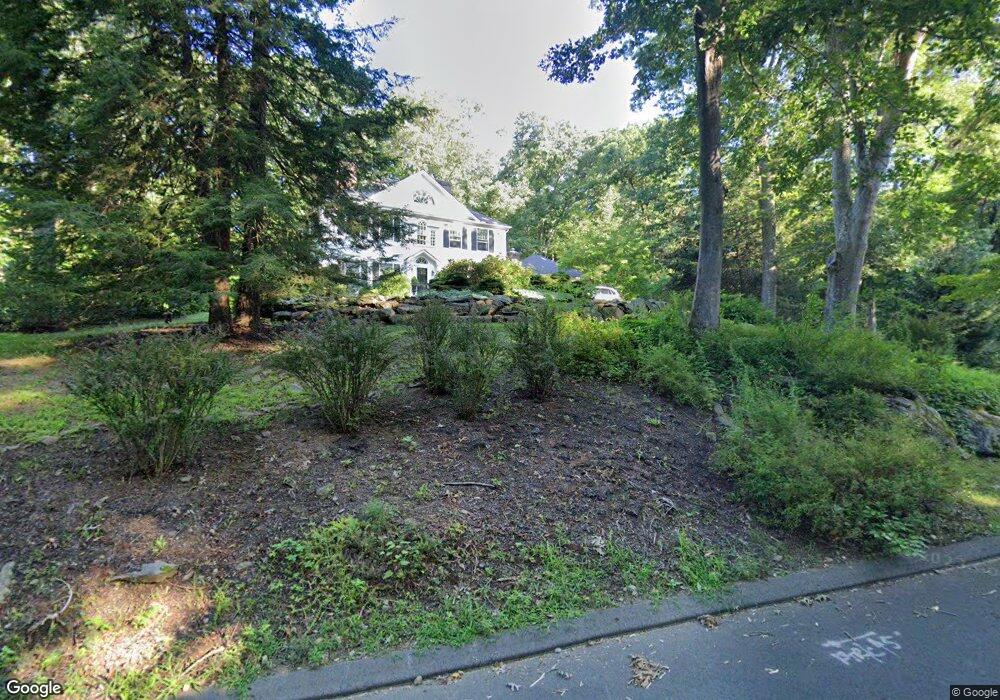
7 Dan Beard Ln Redding, CT 06896
Estimated Value: $1,292,316 - $1,662,000
4
Beds
4
Baths
4,219
Sq Ft
$348/Sq Ft
Est. Value
About This Home
This home is located at 7 Dan Beard Ln, Redding, CT 06896 and is currently estimated at $1,468,829, approximately $348 per square foot. 7 Dan Beard Ln is a home located in Fairfield County with nearby schools including Redding Elementary School, John Read Middle School, and Joel Barlow High School.
Ownership History
Date
Name
Owned For
Owner Type
Purchase Details
Closed on
Apr 25, 2021
Sold by
Knaus David M
Bought by
Knaus David M and Knaus Helen E
Current Estimated Value
Purchase Details
Closed on
Feb 1, 2007
Sold by
Wittemen Alfred O and Wittemen Rose C
Bought by
Knaus David M
Purchase Details
Closed on
Aug 16, 1993
Sold by
Kuhn William J and Dambrosio Madeleine
Bought by
Wittemen Alfred O and Wittemen Rose C
Home Financials for this Owner
Home Financials are based on the most recent Mortgage that was taken out on this home.
Original Mortgage
$474,500
Interest Rate
7.16%
Mortgage Type
Unknown
Purchase Details
Closed on
May 31, 1989
Sold by
Trainer Thomas
Bought by
Kuhn William J
Home Financials for this Owner
Home Financials are based on the most recent Mortgage that was taken out on this home.
Original Mortgage
$400,000
Interest Rate
10.92%
Create a Home Valuation Report for This Property
The Home Valuation Report is an in-depth analysis detailing your home's value as well as a comparison with similar homes in the area
Home Values in the Area
Average Home Value in this Area
Purchase History
| Date | Buyer | Sale Price | Title Company |
|---|---|---|---|
| Knaus David M | -- | None Available | |
| Knaus David M | $1,100,000 | -- | |
| Wittemen Alfred O | $640,000 | -- | |
| Kuhn William J | $601,000 | -- |
Source: Public Records
Mortgage History
| Date | Status | Borrower | Loan Amount |
|---|---|---|---|
| Previous Owner | Kuhn William J | $401,000 | |
| Previous Owner | Kuhn William J | $100,000 | |
| Previous Owner | Kuhn William J | $474,500 | |
| Previous Owner | Kuhn William J | $400,000 |
Source: Public Records
Tax History
| Year | Tax Paid | Tax Assessment Tax Assessment Total Assessment is a certain percentage of the fair market value that is determined by local assessors to be the total taxable value of land and additions on the property. | Land | Improvement |
|---|---|---|---|---|
| 2025 | $21,313 | $721,500 | $182,600 | $538,900 |
| 2024 | $20,721 | $721,500 | $182,600 | $538,900 |
| 2023 | $19,978 | $721,500 | $182,600 | $538,900 |
| 2022 | $20,134 | $603,900 | $212,300 | $391,600 |
| 2021 | $12,835 | $603,900 | $212,300 | $391,600 |
| 2020 | $12,446 | $603,900 | $212,300 | $391,600 |
| 2019 | $12,553 | $603,900 | $212,300 | $391,600 |
| 2018 | $19,156 | $603,900 | $212,300 | $391,600 |
| 2017 | $10,518 | $654,500 | $258,300 | $396,200 |
| 2016 | $19,138 | $654,500 | $258,300 | $396,200 |
| 2015 | $18,922 | $654,500 | $258,300 | $396,200 |
| 2014 | $18,922 | $654,500 | $258,300 | $396,200 |
Source: Public Records
Map
Nearby Homes
- 45 Great Pasture Rd
- 41 Deer Hill Rd
- 36 Fox Run Rd
- 2 Longwood Dr
- 229 Umpawaug Rd
- 24 Costa Ln
- 299 Redding Rd
- 22 Ledgewood Rd
- 74 Seventy Acre Rd
- 219 Redding Rd
- 19 Mine Hill Rd
- 123A Peaceable St
- 7 Long Meadow Ln
- 241 Black Rock Turnpike
- 5 South Ln
- 193 Chestnut Ridge Rd
- 9 New Light Dr
- 9 Chuck Wagon Ln
- 138 Putnam Park Rd
- 15 Laurel Hill Rd
- 9 Dan Beard Ln
- 5 Dan Beard Ln
- 460 Redding Rd
- 18 Beauiles Ln
- 16 Beauiles Ln
- 462 Redding Rd
- 456 Redding Rd
- 27 Great Pasture Rd
- 11 Dan Beard Ln
- 20 Beauiles Ln
- 14 Beauiles Ln
- 19 Dan Beard Ln
- 20 Great Pasture Rd
- 7 Great Pasture Rd
- 23 Great Pasture Rd
- 15 Dan Beard Ln
- 29 Great Pasture Rd
- 18 Great Pasture Rd
- 12 Beauiles Ln
- 5 Beauiles Ln
Your Personal Tour Guide
Ask me questions while you tour the home.