7 Dexter St Coventry, RI 02816
Estimated Value: $342,354 - $360,000
2
Beds
1
Bath
864
Sq Ft
$408/Sq Ft
Est. Value
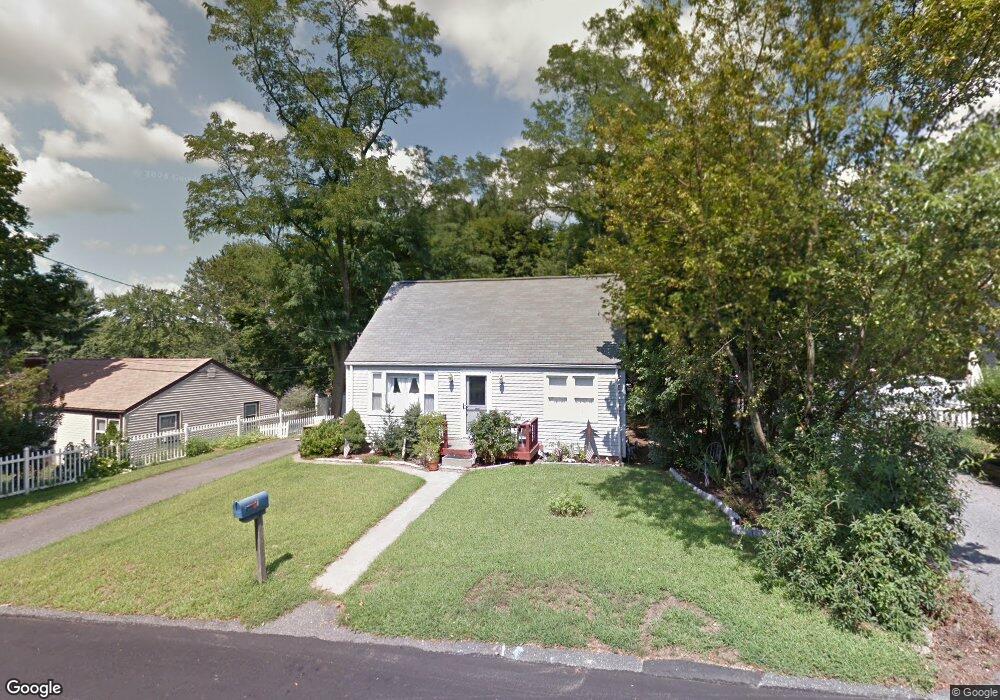
About This Home
This home is located at 7 Dexter St, Coventry, RI 02816 and is currently estimated at $352,339, approximately $407 per square foot. 7 Dexter St is a home located in Kent County with nearby schools including Alan Shawn Feinstein Ms Of Cov, Coventry High School, and Father John V. Doyle School.
Ownership History
Date
Name
Owned For
Owner Type
Purchase Details
Closed on
Jun 19, 2009
Sold by
Burns Richard L Sr Est
Bought by
Freeman Kelley A
Current Estimated Value
Home Financials for this Owner
Home Financials are based on the most recent Mortgage that was taken out on this home.
Original Mortgage
$136,904
Outstanding Balance
$86,032
Interest Rate
4.91%
Mortgage Type
Purchase Money Mortgage
Estimated Equity
$266,307
Create a Home Valuation Report for This Property
The Home Valuation Report is an in-depth analysis detailing your home's value as well as a comparison with similar homes in the area
Purchase History
| Date | Buyer | Sale Price | Title Company |
|---|---|---|---|
| Freeman Kelley A | $149,500 | -- |
Source: Public Records
Mortgage History
| Date | Status | Borrower | Loan Amount |
|---|---|---|---|
| Open | Freeman Kelley A | $136,904 | |
| Closed | Freeman Kelley A | $14,950 |
Source: Public Records
Tax History
| Year | Tax Paid | Tax Assessment Tax Assessment Total Assessment is a certain percentage of the fair market value that is determined by local assessors to be the total taxable value of land and additions on the property. | Land | Improvement |
|---|---|---|---|---|
| 2025 | $3,688 | $229,200 | $88,400 | $140,800 |
| 2024 | $3,631 | $229,200 | $88,400 | $140,800 |
| 2023 | $3,514 | $229,200 | $88,400 | $140,800 |
| 2022 | $3,513 | $179,500 | $85,000 | $94,500 |
| 2021 | $3,482 | $179,500 | $85,000 | $94,500 |
| 2020 | $3,992 | $179,500 | $85,000 | $94,500 |
| 2019 | $3,449 | $155,100 | $71,300 | $83,800 |
| 2018 | $3,352 | $155,100 | $71,300 | $83,800 |
| 2017 | $3,254 | $155,100 | $71,300 | $83,800 |
| 2016 | $2,910 | $135,900 | $59,400 | $76,500 |
| 2015 | $2,831 | $135,900 | $59,400 | $76,500 |
| 2014 | $2,772 | $135,900 | $59,400 | $76,500 |
| 2013 | $2,834 | $151,900 | $76,300 | $75,600 |
Source: Public Records
Map
Nearby Homes
- 21 Darton St
- 27 Matteson St
- 1 Pettine St
- 32 Pilgrim Ave
- 22 Colorado St
- 22 Rawlinson Dr
- 91 Windsor Park Dr
- 45 Pine Ave Unit 36
- 82 Wood St
- 275 E Shore Dr
- 251 E Shore Dr
- 31 Anthony St Unit 33
- 185 Pulaski St
- 37 Holden St
- 33-35 Holden St
- 33 Holden St Unit 35
- 10 Colonial Rd
- 11 Kennedy Dr
- 1152 Main St Unit 1154
- 18 S Main St
Your Personal Tour Guide
Ask me questions while you tour the home.