Estimated Value: $488,457 - $517,000
1
Bed
1
Bath
1,344
Sq Ft
$376/Sq Ft
Est. Value
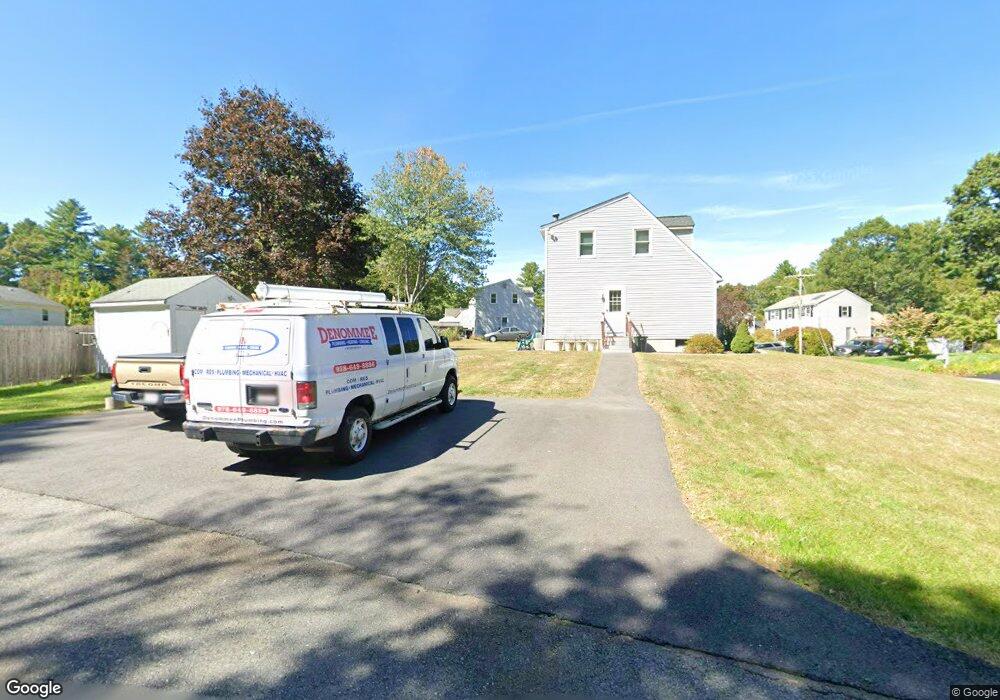
About This Home
This home is located at 7 Doug Rd, Ayer, MA 01432 and is currently estimated at $505,864, approximately $376 per square foot. 7 Doug Rd is a home located in Middlesex County with nearby schools including Page Hilltop School, Lura A. White Elementary School, and Ayer Shirley Regional Middle School.
Ownership History
Date
Name
Owned For
Owner Type
Purchase Details
Closed on
May 3, 2005
Sold by
Jeunesse Leigh
Bought by
Jeunesse Christopher Lee and Jeunesse Leigh
Current Estimated Value
Home Financials for this Owner
Home Financials are based on the most recent Mortgage that was taken out on this home.
Original Mortgage
$243,000
Outstanding Balance
$127,596
Interest Rate
5.95%
Mortgage Type
Purchase Money Mortgage
Estimated Equity
$378,268
Purchase Details
Closed on
Sep 9, 1994
Sold by
Douglas Dr Rt
Bought by
Bonner Joseph E and Bonner Leigh
Purchase Details
Closed on
Mar 20, 1992
Sold by
Seven C'S Rt
Bought by
Doug Rd Rt
Create a Home Valuation Report for This Property
The Home Valuation Report is an in-depth analysis detailing your home's value as well as a comparison with similar homes in the area
Home Values in the Area
Average Home Value in this Area
Purchase History
| Date | Buyer | Sale Price | Title Company |
|---|---|---|---|
| Jeunesse Christopher Lee | -- | -- | |
| Bonner Joseph E | $114,500 | -- | |
| Doug Rd Rt | $110,000 | -- |
Source: Public Records
Mortgage History
| Date | Status | Borrower | Loan Amount |
|---|---|---|---|
| Open | Jeunesse Christopher Lee | $243,000 | |
| Previous Owner | Doug Rd Rt | $146,000 | |
| Previous Owner | Doug Rd Rt | $21,400 | |
| Previous Owner | Doug Rd Rt | $110,000 |
Source: Public Records
Tax History
| Year | Tax Paid | Tax Assessment Tax Assessment Total Assessment is a certain percentage of the fair market value that is determined by local assessors to be the total taxable value of land and additions on the property. | Land | Improvement |
|---|---|---|---|---|
| 2025 | $4,507 | $376,800 | $142,600 | $234,200 |
| 2024 | $4,616 | $376,800 | $162,900 | $213,900 |
| 2023 | $4,342 | $349,600 | $152,900 | $196,700 |
| 2022 | $4,194 | $312,500 | $133,000 | $179,500 |
| 2021 | $5,973 | $295,800 | $120,100 | $175,700 |
| 2020 | $3,882 | $275,300 | $115,700 | $159,600 |
| 2019 | $3,601 | $264,200 | $110,300 | $153,900 |
| 2018 | $3,641 | $252,300 | $107,000 | $145,300 |
| 2017 | $3,485 | $242,200 | $103,900 | $138,300 |
| 2016 | $3,362 | $231,400 | $103,600 | $127,800 |
| 2015 | $3,291 | $225,100 | $103,600 | $121,500 |
| 2014 | $3,143 | $223,200 | $103,600 | $119,600 |
Source: Public Records
Map
Nearby Homes
- 17 Jonathan Dr
- 98 Pleasant St
- 9 Gaskins Ln
- 0ABC Park St
- 23 Nashua St
- 36 Norwood Ave
- 401 Autumn Ridge Dr
- 14 Brook St
- 21 High St
- 33 Worthen Dr
- 100 Central Ave Unit 4
- 63 E Main St
- 72 Dale Ln
- 86 E Main St
- 25 Pine Ridge Dr
- 129 Oak Ridge Dr
- 24 Harvard Rd Unit C
- 210 Indian Hill Rd
- 75 Sandy Pond Rd Unit 24
- 75 Sandy Pond Rd Unit 41
Your Personal Tour Guide
Ask me questions while you tour the home.