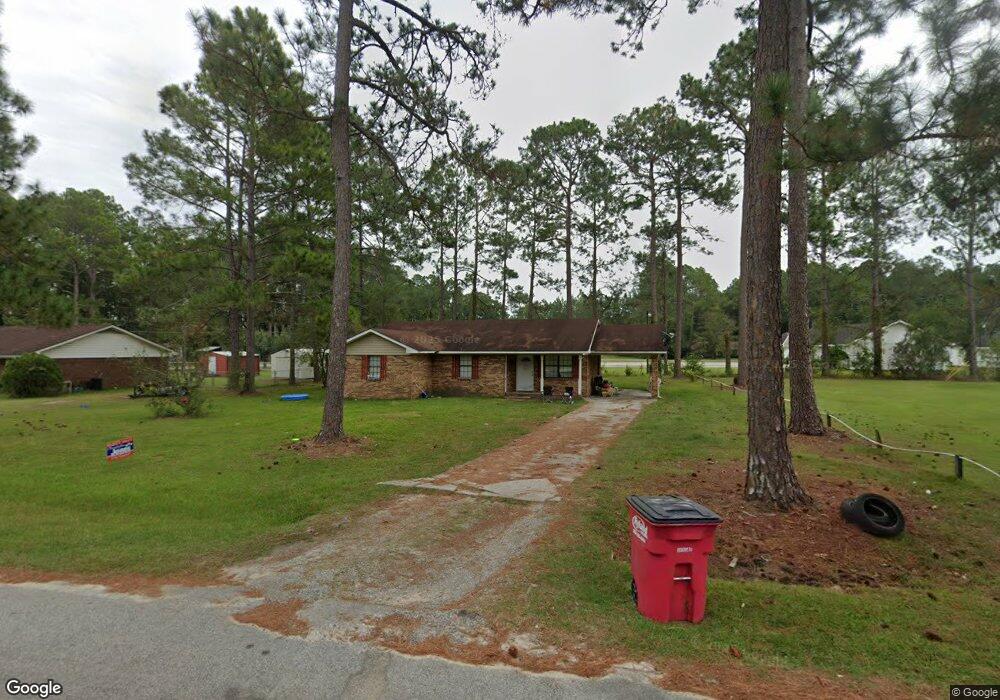
7 Douglas St Hazlehurst, GA 31539
Estimated Value: $137,000 - $178,000
3
Beds
2
Baths
1,225
Sq Ft
$129/Sq Ft
Est. Value
About This Home
This home is located at 7 Douglas St, Hazlehurst, GA 31539 and is currently estimated at $157,686, approximately $128 per square foot. 7 Douglas St is a home located in Jeff Davis County with nearby schools including Jeff Davis Primary School, Jeff Davis Elementary School, and Jeff Davis Middle School.
Ownership History
Date
Name
Owned For
Owner Type
Purchase Details
Closed on
Jul 2, 2013
Sold by
Harrell William David
Bought by
Bdc Inc
Current Estimated Value
Purchase Details
Closed on
Feb 5, 2010
Sold by
Bdc Inc
Bought by
Harrell William David
Purchase Details
Closed on
Jan 5, 2010
Sold by
Usda Rural Development
Bought by
Harrell Charles
Purchase Details
Closed on
Jan 1, 1986
Bought by
Taylor Oliver G
Create a Home Valuation Report for This Property
The Home Valuation Report is an in-depth analysis detailing your home's value as well as a comparison with similar homes in the area
Home Values in the Area
Average Home Value in this Area
Purchase History
| Date | Buyer | Sale Price | Title Company |
|---|---|---|---|
| Bdc Inc | -- | -- | |
| Harrell William David | $80,000 | -- | |
| Harrell Charles | -- | -- | |
| Taylor Oliver G | $38,300 | -- |
Source: Public Records
Tax History Compared to Growth
Tax History
| Year | Tax Paid | Tax Assessment Tax Assessment Total Assessment is a certain percentage of the fair market value that is determined by local assessors to be the total taxable value of land and additions on the property. | Land | Improvement |
|---|---|---|---|---|
| 2024 | $1,477 | $39,520 | $2,880 | $36,640 |
| 2023 | $1,001 | $26,781 | $2,880 | $23,901 |
| 2022 | $1,001 | $26,781 | $2,880 | $23,901 |
| 2021 | $1,001 | $26,781 | $2,880 | $23,901 |
| 2020 | $1,001 | $26,781 | $2,880 | $23,901 |
| 2019 | $1,024 | $27,381 | $2,880 | $24,501 |
| 2018 | $1,024 | $27,381 | $2,880 | $24,501 |
| 2017 | $714 | $24,712 | $2,000 | $22,712 |
| 2016 | $676 | $23,836 | $2,000 | $21,836 |
| 2015 | -- | $23,836 | $2,000 | $21,836 |
| 2014 | -- | $23,836 | $2,000 | $21,836 |
Source: Public Records
Map
Nearby Homes
- 00 Pat Dixon St & Charles Rogers Blvd
- 0 Collins St
- 0 Charles Rogers Blvd
- 54 Walton Way
- 102 W Palm Rd
- 44 Kersey St
- 9 Kersey St
- 73 Latimer St
- 393 Douglas Hwy
- 45 Elton St
- 116 Walton Way
- 20 W Sycamore St
- 4 Lakeside Dr
- 39 N Tallahassee St
- 58 Currie St
- 0 Tallahassee St Unit 10554247
- 53 Mockingbird Ln
- 19 Martin Luther King jr Blvd
- 21 Pine St
- 16 Beech Rd