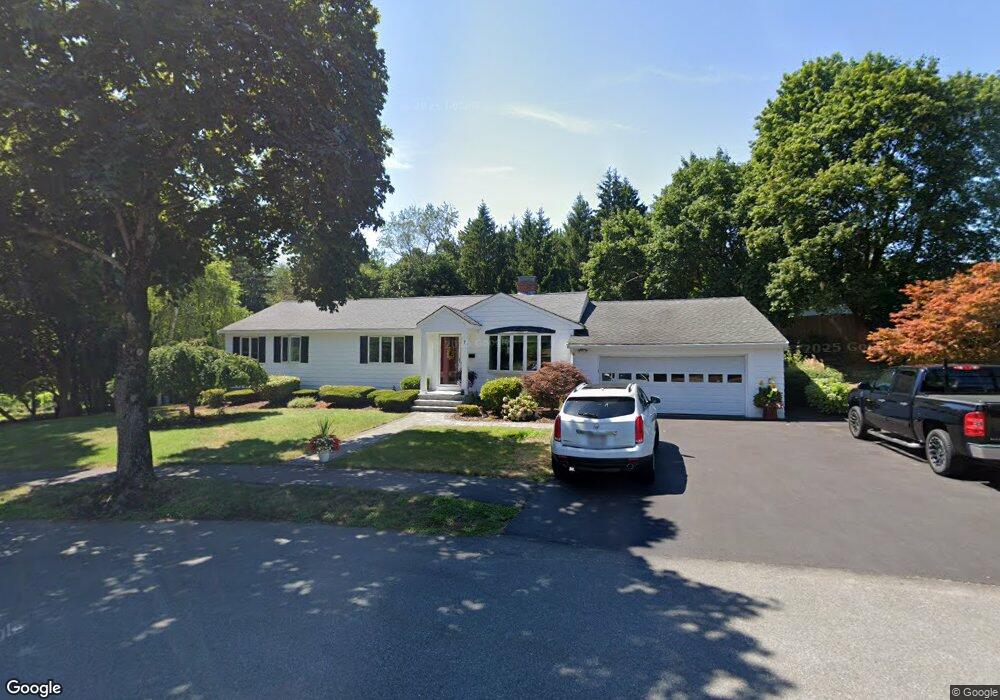
7 Drury Ln Danvers, MA 01923
Estimated Value: $741,000 - $812,000
3
Beds
3
Baths
1,800
Sq Ft
$428/Sq Ft
Est. Value
About This Home
This home is located at 7 Drury Ln, Danvers, MA 01923 and is currently estimated at $770,927, approximately $428 per square foot. 7 Drury Ln is a home located in Essex County with nearby schools including Danvers High School, St. Mary of the Annunciation School, and Plumfield Academy.
Ownership History
Date
Name
Owned For
Owner Type
Purchase Details
Closed on
Dec 5, 2014
Sold by
Moreschi Michael A and Moreschi Denise R
Bought by
Moreschi Ft and Rennick
Current Estimated Value
Purchase Details
Closed on
Aug 31, 2012
Sold by
Moreschi Denise
Bought by
Moreschi Denise and Rennick Megan M
Create a Home Valuation Report for This Property
The Home Valuation Report is an in-depth analysis detailing your home's value as well as a comparison with similar homes in the area
Home Values in the Area
Average Home Value in this Area
Purchase History
| Date | Buyer | Sale Price | Title Company |
|---|---|---|---|
| Moreschi Ft | -- | -- | |
| Moreschi Michael A | -- | -- | |
| Moreschi Denise | -- | -- | |
| Moreschi Ft | -- | -- | |
| Moreschi Denise | -- | -- |
Source: Public Records
Mortgage History
| Date | Status | Borrower | Loan Amount |
|---|---|---|---|
| Previous Owner | Moreschi Denise | $71,000 | |
| Previous Owner | Moreschi Denise | $145,000 |
Source: Public Records
Tax History
| Year | Tax Paid | Tax Assessment Tax Assessment Total Assessment is a certain percentage of the fair market value that is determined by local assessors to be the total taxable value of land and additions on the property. | Land | Improvement |
|---|---|---|---|---|
| 2025 | $7,608 | $692,300 | $401,200 | $291,100 |
| 2024 | $7,551 | $679,700 | $401,200 | $278,500 |
| 2023 | $7,259 | $617,800 | $364,600 | $253,200 |
| 2022 | $7,090 | $560,000 | $330,800 | $229,200 |
| 2021 | $6,740 | $504,900 | $313,400 | $191,500 |
| 2020 | $6,546 | $501,200 | $309,700 | $191,500 |
| 2019 | $6,283 | $473,100 | $281,600 | $191,500 |
| 2018 | $6,070 | $448,300 | $278,800 | $169,500 |
| 2017 | $5,825 | $410,500 | $243,600 | $166,900 |
| 2016 | $5,547 | $390,600 | $232,300 | $158,300 |
| 2015 | $5,256 | $352,500 | $211,200 | $141,300 |
Source: Public Records
Map
Nearby Homes
- 98 Newbury St Unit 18B
- 98 Newbury St Unit 23B
- 103 Newbury St Unit 1
- 286 Newbury St Unit 110
- 37 Peaslee Cir Unit 37
- 102 Centre St
- 261 Newbury St Unit 17A
- 252 Newbury St Unit 1
- 252 Newbury St
- 19 Peachey Cir
- 4 Curwen Rd
- 3 Ledgewood Way Unit 8
- 8 Ledgewood Way Unit 20
- 9 Ledgewood Way Unit 6
- 6 Greystone Dr
- 17 Bourbon St Unit 76
- 20 Bellingham Ct
- 31 Styles Dr
- 11 Spring St
- 1 Mills Point Unit 1
Your Personal Tour Guide
Ask me questions while you tour the home.