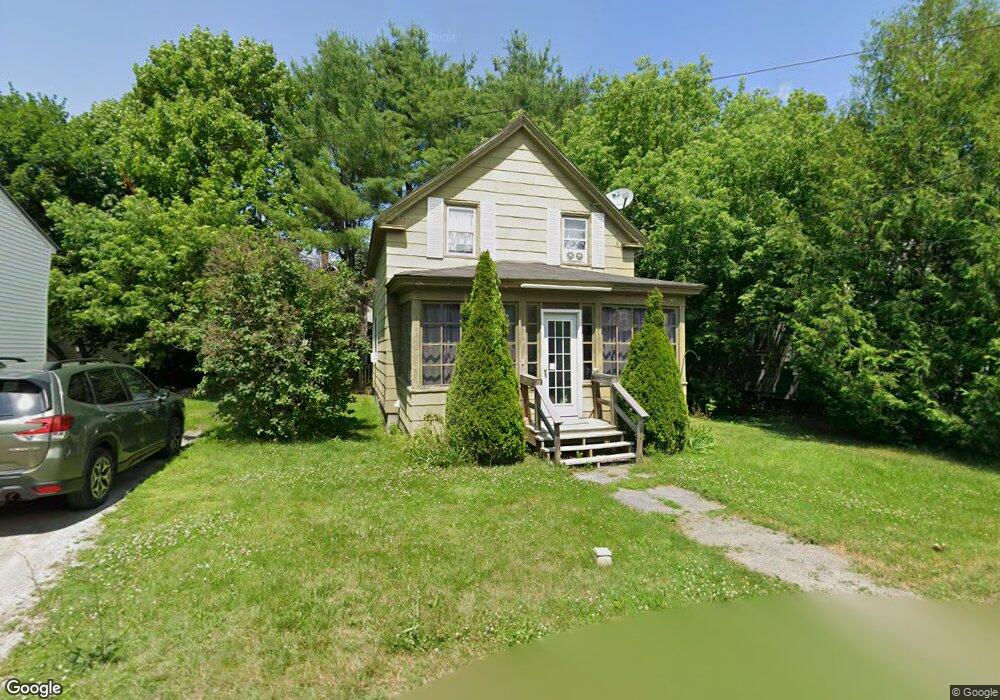
7 Dunbar Ct Waterville, ME 04901
Estimated Value: $163,000 - $210,000
2
Beds
2
Baths
950
Sq Ft
$191/Sq Ft
Est. Value
About This Home
This home is located at 7 Dunbar Ct, Waterville, ME 04901 and is currently estimated at $181,302, approximately $190 per square foot. 7 Dunbar Ct is a home located in Kennebec County with nearby schools including George J. Mitchell School, Albert S. Hall School, and Waterville Junior High School.
Ownership History
Date
Name
Owned For
Owner Type
Purchase Details
Closed on
Jul 14, 2017
Sold by
Southern Angel Properties
Bought by
Belcher Nathan E
Current Estimated Value
Home Financials for this Owner
Home Financials are based on the most recent Mortgage that was taken out on this home.
Original Mortgage
$39,750
Outstanding Balance
$32,911
Interest Rate
3.94%
Mortgage Type
Unknown
Estimated Equity
$148,391
Purchase Details
Closed on
Jul 9, 2010
Sold by
Pressey Robert J and Pressey Sylvia D
Bought by
Southern Angel Props Llc
Create a Home Valuation Report for This Property
The Home Valuation Report is an in-depth analysis detailing your home's value as well as a comparison with similar homes in the area
Home Values in the Area
Average Home Value in this Area
Purchase History
| Date | Buyer | Sale Price | Title Company |
|---|---|---|---|
| Belcher Nathan E | -- | -- | |
| Southern Angel Props Llc | -- | -- |
Source: Public Records
Mortgage History
| Date | Status | Borrower | Loan Amount |
|---|---|---|---|
| Open | Belcher Nathan E | $39,750 |
Source: Public Records
Tax History Compared to Growth
Tax History
| Year | Tax Paid | Tax Assessment Tax Assessment Total Assessment is a certain percentage of the fair market value that is determined by local assessors to be the total taxable value of land and additions on the property. | Land | Improvement |
|---|---|---|---|---|
| 2025 | $1,693 | $99,600 | $12,900 | $86,700 |
| 2024 | $1,538 | $76,900 | $9,900 | $67,000 |
| 2023 | $1,530 | $76,900 | $9,900 | $67,000 |
| 2022 | $1,016 | $39,300 | $7,500 | $31,800 |
| 2021 | $1,002 | $39,300 | $7,500 | $31,800 |
| 2020 | $1,012 | $39,300 | $7,500 | $31,800 |
| 2019 | $1,012 | $39,300 | $7,500 | $31,800 |
| 2018 | $993 | $39,300 | $7,500 | $31,800 |
| 2017 | $917 | $39,300 | $7,500 | $31,800 |
| 2016 | $896 | $39,300 | $7,500 | $31,800 |
| 2015 | $1,131 | $40,700 | $8,600 | $32,100 |
| 2014 | $1,115 | $40,700 | $8,600 | $32,100 |
| 2013 | $852 | $31,100 | $8,600 | $22,500 |
Source: Public Records
Map
Nearby Homes