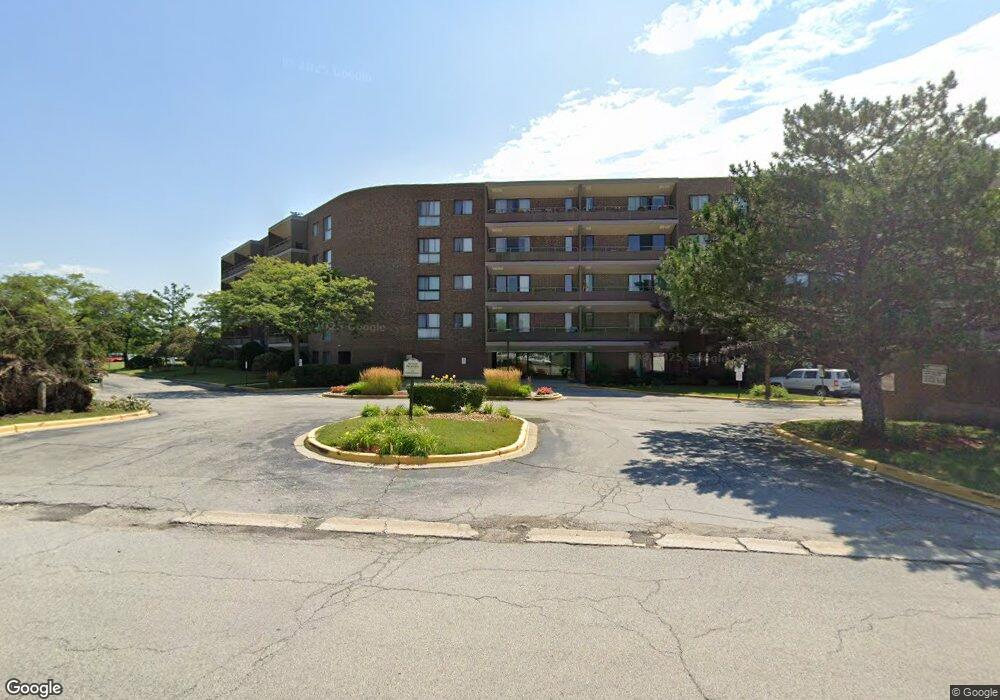
Stone Bridge 7 E Carriageway Dr Unit 103 Hazel Crest, IL 60429
Stonebridge NeighborhoodEstimated Value: $76,000 - $97,000
3
Beds
2
Baths
1,000
Sq Ft
$89/Sq Ft
Est. Value
About This Home
This home is located at 7 E Carriageway Dr Unit 103, Hazel Crest, IL 60429 and is currently estimated at $89,403, approximately $89 per square foot. 7 E Carriageway Dr Unit 103 is a home located in Cook County with nearby schools including Mae Jemison School, Prairie-Hills Junior High School, and Hillcrest High School.
Ownership History
Date
Name
Owned For
Owner Type
Purchase Details
Closed on
Nov 10, 2023
Sold by
Jones Shanita M
Bought by
Ttoille Llc
Current Estimated Value
Purchase Details
Closed on
Mar 29, 2004
Sold by
Wachovia Bank Na
Bought by
Jones Shanita
Home Financials for this Owner
Home Financials are based on the most recent Mortgage that was taken out on this home.
Original Mortgage
$80,000
Interest Rate
6.25%
Mortgage Type
Unknown
Purchase Details
Closed on
Jul 8, 2002
Sold by
Johnson Sarah
Bought by
First Union National Bank Nba and Long Beach Mtg Loan Trust 2000-1
Purchase Details
Closed on
Nov 10, 2000
Sold by
Montes Paul J
Bought by
Johnson Sarah
Home Financials for this Owner
Home Financials are based on the most recent Mortgage that was taken out on this home.
Original Mortgage
$75,510
Interest Rate
10.55%
Create a Home Valuation Report for This Property
The Home Valuation Report is an in-depth analysis detailing your home's value as well as a comparison with similar homes in the area
Home Values in the Area
Average Home Value in this Area
Purchase History
| Date | Buyer | Sale Price | Title Company |
|---|---|---|---|
| Ttoille Llc | -- | None Listed On Document | |
| Jones Shanita | $80,000 | Ticor Title | |
| First Union National Bank Nba | -- | -- | |
| Johnson Sarah | $84,000 | Chicago Title Insurance Co |
Source: Public Records
Mortgage History
| Date | Status | Borrower | Loan Amount |
|---|---|---|---|
| Previous Owner | Jones Shanita | $80,000 | |
| Previous Owner | Johnson Sarah | $75,510 |
Source: Public Records
Tax History
| Year | Tax Paid | Tax Assessment Tax Assessment Total Assessment is a certain percentage of the fair market value that is determined by local assessors to be the total taxable value of land and additions on the property. | Land | Improvement |
|---|---|---|---|---|
| 2025 | $4,075 | $7,956 | $170 | $7,786 |
| 2024 | $4,075 | $7,956 | $170 | $7,786 |
| 2023 | $3,218 | $7,955 | $169 | $7,786 |
| 2022 | $3,218 | $4,385 | $469 | $3,916 |
| 2021 | $3,101 | $4,383 | $468 | $3,915 |
| 2020 | $2,944 | $4,383 | $468 | $3,915 |
| 2019 | $2,460 | $3,674 | $428 | $3,246 |
| 2018 | $2,384 | $3,674 | $428 | $3,246 |
| 2017 | $3,994 | $6,589 | $428 | $6,161 |
| 2016 | $2,990 | $5,114 | $368 | $4,746 |
| 2015 | $2,864 | $5,114 | $368 | $4,746 |
| 2014 | $2,794 | $5,114 | $368 | $4,746 |
| 2013 | $2,778 | $5,800 | $368 | $5,432 |
Source: Public Records
About Stone Bridge
Map
Nearby Homes
- 7 E Carriageway Dr Unit 311
- 5 E Carriageway Dr Unit 308
- 5 E Carriageway Dr Unit 201
- 2912 175th St
- 17405 Longfellow Ave
- 2900 175th St
- 17613 Grandview Dr
- 17410 Emerson Ave
- 3107 Longfellow Ave
- 17718 Ridgewood Dr
- 3006 Buttonwood Walk
- 2722 Cherrywood Place
- 17417 Kedzie Ave
- 17714 Dogwood Ln
- 3100 Longfellow Ave
- 2908 Buttonwood Walk
- 17804 Pebblewood Ln
- 2715 Knollwood Place
- 2711 Larkspur Ln
- 3004 Longfellow Ave
- 7 E Carriageway Dr Unit 208
- 7 E Carriageway Dr Unit PH01
- 7 E Carriageway Dr Unit 108
- 7 E Carriageway Dr Unit 403
- 7 E Carriageway Dr Unit 411
- 7 E Carriageway Dr Unit 310
- 7 E Carriageway Dr Unit PH10
- 7 E Carriageway Dr Unit 414
- 7 E Carriageway Dr Unit 404
- 7 E Carriageway Dr Unit 211
- 7 E Carriageway Dr Unit 106
- 7 E Carriageway Dr Unit PH14
- 7 E Carriageway Dr Unit PH09
- 7 E Carriageway Dr Unit 405
- 7 E Carriageway Dr Unit 307
- 7 E Carriageway Dr Unit 304
- 7 E Carriageway Dr Unit 209
- 7 E Carriageway Dr Unit 214
- 7 E Carriageway Dr Unit PH03
- 7 E Carriageway Dr Unit 309
Your Personal Tour Guide
Ask me questions while you tour the home.