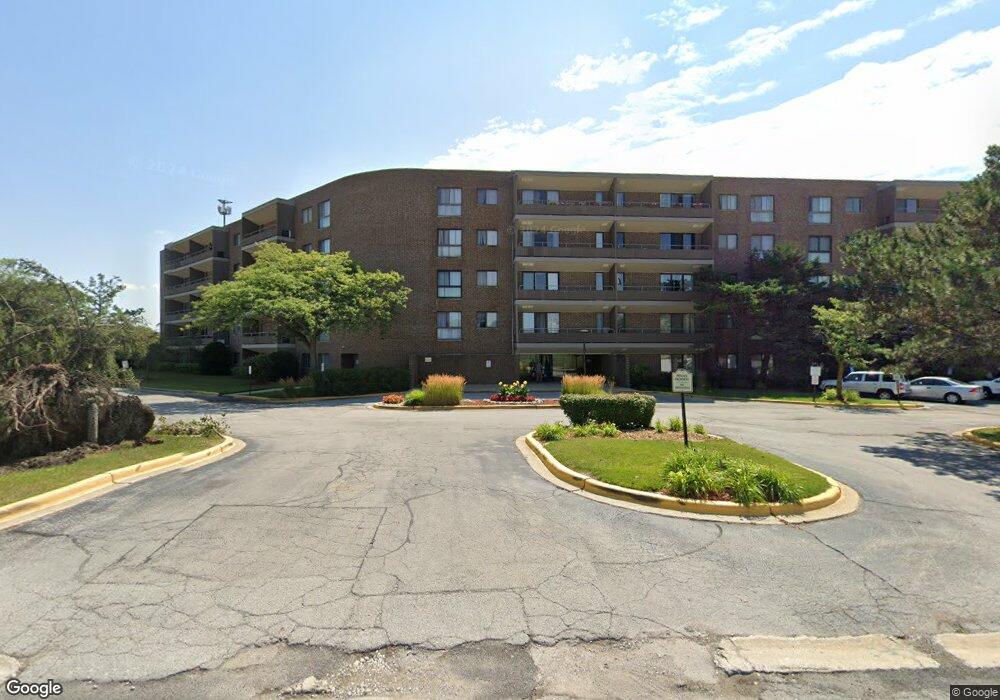
Stone Bridge 7 E Carriageway Dr Unit 403 Hazel Crest, IL 60429
Stonebridge NeighborhoodEstimated Value: $87,000 - $141,000
3
Beds
2
Baths
1,000
Sq Ft
$108/Sq Ft
Est. Value
About This Home
This home is located at 7 E Carriageway Dr Unit 403, Hazel Crest, IL 60429 and is currently estimated at $108,490, approximately $108 per square foot. 7 E Carriageway Dr Unit 403 is a home located in Cook County with nearby schools including Mae Jemison School, Prairie-Hills Junior High School, and Hillcrest High School.
Ownership History
Date
Name
Owned For
Owner Type
Purchase Details
Closed on
Jan 10, 2003
Sold by
Robinson Delores
Bought by
Younger Teresa
Current Estimated Value
Home Financials for this Owner
Home Financials are based on the most recent Mortgage that was taken out on this home.
Original Mortgage
$72,750
Interest Rate
6.13%
Mortgage Type
Purchase Money Mortgage
Purchase Details
Closed on
Aug 30, 1996
Sold by
Shutan Alvina L
Bought by
Robinson Dolores P
Home Financials for this Owner
Home Financials are based on the most recent Mortgage that was taken out on this home.
Original Mortgage
$72,650
Interest Rate
7.97%
Purchase Details
Closed on
Oct 3, 1994
Sold by
Shutan Alvina L
Bought by
Shutan Alvina L
Purchase Details
Closed on
Dec 3, 1993
Sold by
Shutan Alvina L
Bought by
Shutan Alvina L
Create a Home Valuation Report for This Property
The Home Valuation Report is an in-depth analysis detailing your home's value as well as a comparison with similar homes in the area
Home Values in the Area
Average Home Value in this Area
Purchase History
| Date | Buyer | Sale Price | Title Company |
|---|---|---|---|
| Younger Teresa | $75,000 | -- | |
| Robinson Dolores P | $76,500 | -- | |
| Shutan Alvina L | -- | -- | |
| Shutan Alvina L | -- | -- |
Source: Public Records
Mortgage History
| Date | Status | Borrower | Loan Amount |
|---|---|---|---|
| Previous Owner | Younger Teresa | $72,750 | |
| Previous Owner | Robinson Dolores P | $72,650 |
Source: Public Records
Tax History
| Year | Tax Paid | Tax Assessment Tax Assessment Total Assessment is a certain percentage of the fair market value that is determined by local assessors to be the total taxable value of land and additions on the property. | Land | Improvement |
|---|---|---|---|---|
| 2025 | $2,559 | $8,312 | $177 | $8,135 |
| 2024 | $2,559 | $8,312 | $177 | $8,135 |
| 2023 | $851 | $8,312 | $177 | $8,135 |
| 2022 | $851 | $4,582 | $490 | $4,092 |
| 2021 | $884 | $4,580 | $489 | $4,091 |
| 2020 | $993 | $4,580 | $489 | $4,091 |
| 2019 | $2,313 | $6,884 | $447 | $6,437 |
| 2018 | $2,238 | $6,884 | $447 | $6,437 |
| 2017 | $2,127 | $6,884 | $447 | $6,437 |
| 2016 | $1,664 | $5,344 | $385 | $4,959 |
| 2015 | $1,524 | $5,344 | $385 | $4,959 |
| 2014 | $1,516 | $5,344 | $385 | $4,959 |
| 2013 | $3,167 | $9,242 | $385 | $8,857 |
Source: Public Records
About Stone Bridge
Map
Nearby Homes
- 7 E Carriageway Dr Unit 311
- 5 E Carriageway Dr Unit 210
- 2912 175th St
- 17622 Oakwood Dr
- 17405 Longfellow Ave
- 2900 175th St
- 17613 Grandview Dr
- 17410 Emerson Ave
- 3107 Longfellow Ave
- 17417 Kedzie Ave
- 17714 Dogwood Ln
- 3100 Longfellow Ave
- 2908 Buttonwood Walk
- 17804 Pebblewood Ln
- 2711 Larkspur Ln
- 3004 Longfellow Ave
- 17803 Dogwood Ln
- 17805 Dogwood Ln
- 2800 174th St
- 3107 173rd St
- 7 E Carriageway Dr Unit 208
- 7 E Carriageway Dr Unit PH01
- 7 E Carriageway Dr Unit 108
- 7 E Carriageway Dr Unit 411
- 7 E Carriageway Dr Unit 310
- 7 E Carriageway Dr Unit PH10
- 7 E Carriageway Dr Unit 414
- 7 E Carriageway Dr Unit 404
- 7 E Carriageway Dr Unit 211
- 7 E Carriageway Dr Unit 106
- 7 E Carriageway Dr Unit PH14
- 7 E Carriageway Dr Unit PH09
- 7 E Carriageway Dr Unit 405
- 7 E Carriageway Dr Unit 307
- 7 E Carriageway Dr Unit 304
- 7 E Carriageway Dr Unit 209
- 7 E Carriageway Dr Unit 214
- 7 E Carriageway Dr Unit 103
- 7 E Carriageway Dr Unit PH03
- 7 E Carriageway Dr Unit 309