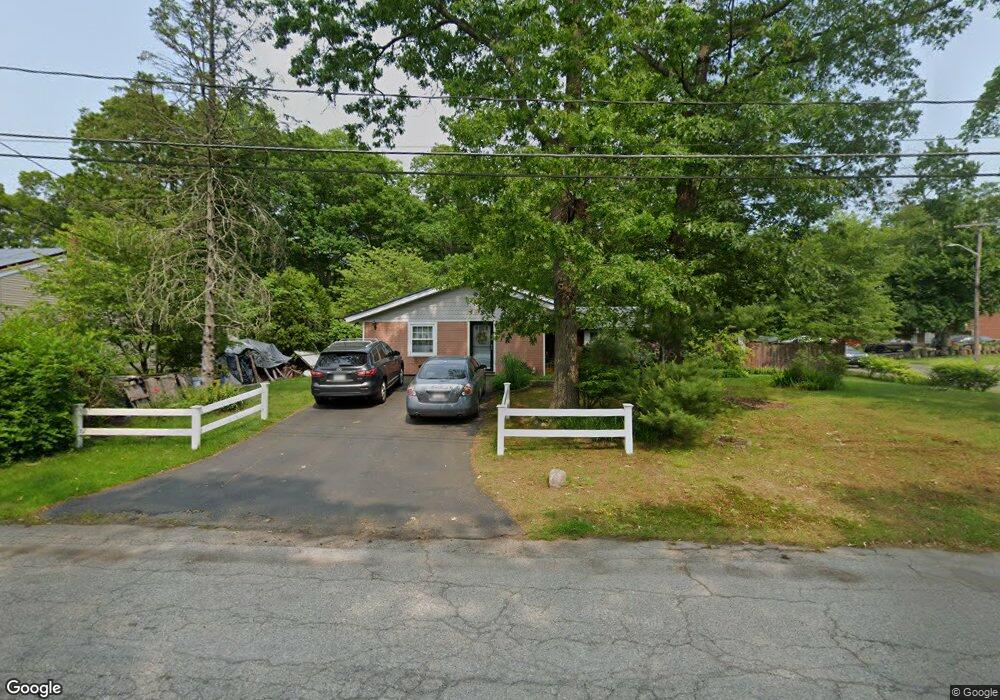
7 Flint Rd Brockton, MA 02302
Estimated Value: $526,000 - $656,000
4
Beds
3
Baths
2,294
Sq Ft
$258/Sq Ft
Est. Value
About This Home
This home is located at 7 Flint Rd, Brockton, MA 02302 and is currently estimated at $592,493, approximately $258 per square foot. 7 Flint Rd is a home located in Plymouth County with nearby schools including Gilmore Elementary School, Davis K-8 School, and John F. Kennedy Elementary School.
Ownership History
Date
Name
Owned For
Owner Type
Purchase Details
Closed on
Mar 4, 2010
Sold by
Kubis Anna Maria
Bought by
Kubis Ft and Kubis Anna Maria
Current Estimated Value
Purchase Details
Closed on
Jun 25, 1998
Sold by
Dearing Elizabeth A and Greenidge Donald W
Bought by
Kubis Anna M
Create a Home Valuation Report for This Property
The Home Valuation Report is an in-depth analysis detailing your home's value as well as a comparison with similar homes in the area
Purchase History
| Date | Buyer | Sale Price | Title Company |
|---|---|---|---|
| Kubis Ft | -- | -- | |
| Kubis Anna M | $122,000 | -- |
Source: Public Records
Mortgage History
| Date | Status | Borrower | Loan Amount |
|---|---|---|---|
| Open | Kubis Anna M | $55,000 | |
| Previous Owner | Kubis Anna M | $50,000 | |
| Previous Owner | Kubis Anna M | $136,000 | |
| Previous Owner | Kubis Anna M | $15,000 |
Source: Public Records
Tax History
| Year | Tax Paid | Tax Assessment Tax Assessment Total Assessment is a certain percentage of the fair market value that is determined by local assessors to be the total taxable value of land and additions on the property. | Land | Improvement |
|---|---|---|---|---|
| 2025 | $6,185 | $510,700 | $162,300 | $348,400 |
| 2024 | $6,641 | $552,500 | $162,300 | $390,200 |
| 2023 | $5,697 | $438,900 | $112,600 | $326,300 |
| 2022 | $5,507 | $394,200 | $102,400 | $291,800 |
| 2021 | $5,509 | $379,900 | $95,700 | $284,200 |
| 2020 | $5,671 | $374,300 | $83,700 | $290,600 |
| 2019 | $5,726 | $368,500 | $80,200 | $288,300 |
| 2018 | $5,061 | $315,100 | $80,200 | $234,900 |
| 2017 | $4,721 | $293,200 | $80,200 | $213,000 |
| 2016 | $4,387 | $252,700 | $76,400 | $176,300 |
| 2015 | $4,249 | $234,100 | $76,400 | $157,700 |
| 2014 | $4,242 | $234,000 | $76,400 | $157,600 |
Source: Public Records
Map
Nearby Homes
- 578 Plain St
- 23 Dondi Rd
- 118 Deanna Rd
- 15 Wachusetts Rd
- 12 Paulin Ave
- 1 Thomas Cir
- 549 Summer St
- 463 Pleasant St
- 31 Friendship Dr
- 111 Riverview St
- 55 Marjan Dr
- 10 Colleen Way
- 16 Liberty St
- 9 Longworth Ave Unit 135
- 9 Longworth Ave Unit 113
- 15 Longworth Ave Unit 226
- 25 Longworth Ave Unit 4
- 16 Jason Way
- 35 Longworth Ave Unit 25
- 41 Riverview St
Your Personal Tour Guide
Ask me questions while you tour the home.