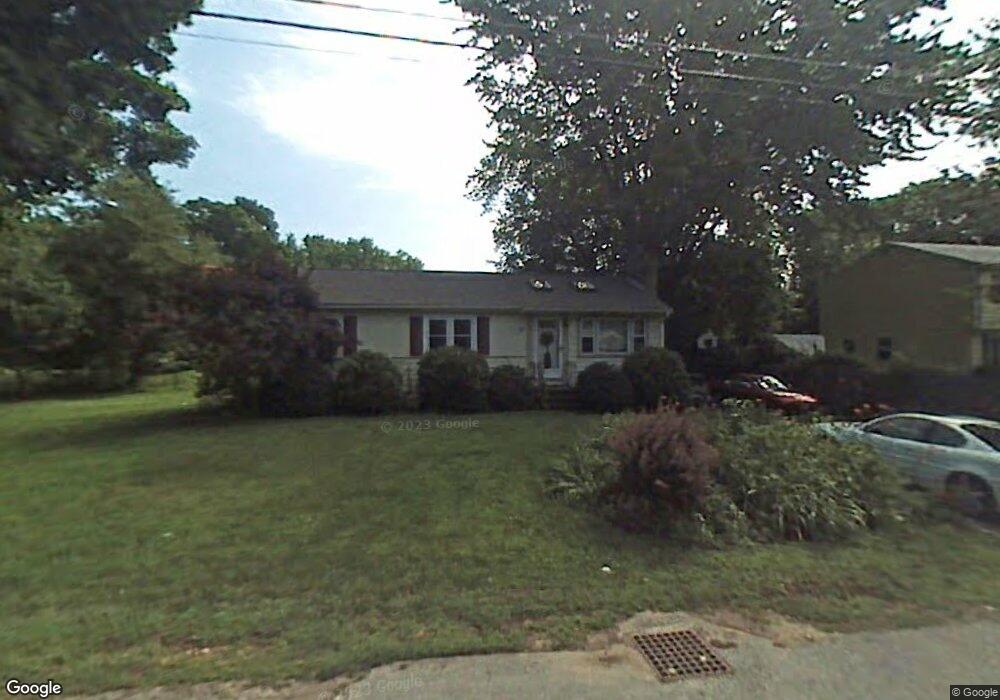
7 Florence St Littleton, MA 01460
Littleton Common NeighborhoodEstimated Value: $538,000 - $577,000
3
Beds
1
Bath
1,512
Sq Ft
$371/Sq Ft
Est. Value
About This Home
This home is located at 7 Florence St, Littleton, MA 01460 and is currently estimated at $561,004, approximately $371 per square foot. 7 Florence St is a home located in Middlesex County with nearby schools including Shaker Lane Elementary School, Russell Street Elementary School, and Littleton Middle School.
Ownership History
Date
Name
Owned For
Owner Type
Purchase Details
Closed on
Dec 23, 1998
Sold by
Palmer David and Palmer Susan
Bought by
Shearer Candace J
Current Estimated Value
Home Financials for this Owner
Home Financials are based on the most recent Mortgage that was taken out on this home.
Original Mortgage
$150,600
Outstanding Balance
$34,534
Interest Rate
6.89%
Mortgage Type
Purchase Money Mortgage
Estimated Equity
$526,470
Purchase Details
Closed on
Jun 9, 1997
Sold by
Burgess Charles J and Burgess Patricia A
Bought by
Palmer David and Palmer Susan
Home Financials for this Owner
Home Financials are based on the most recent Mortgage that was taken out on this home.
Original Mortgage
$136,800
Interest Rate
7.98%
Mortgage Type
Purchase Money Mortgage
Create a Home Valuation Report for This Property
The Home Valuation Report is an in-depth analysis detailing your home's value as well as a comparison with similar homes in the area
Home Values in the Area
Average Home Value in this Area
Purchase History
| Date | Buyer | Sale Price | Title Company |
|---|---|---|---|
| Shearer Candace J | $155,000 | -- | |
| Palmer David | $152,000 | -- |
Source: Public Records
Mortgage History
| Date | Status | Borrower | Loan Amount |
|---|---|---|---|
| Open | Palmer David | $150,600 | |
| Previous Owner | Palmer David | $136,800 | |
| Previous Owner | Palmer David | $113,200 |
Source: Public Records
Tax History Compared to Growth
Tax History
| Year | Tax Paid | Tax Assessment Tax Assessment Total Assessment is a certain percentage of the fair market value that is determined by local assessors to be the total taxable value of land and additions on the property. | Land | Improvement |
|---|---|---|---|---|
| 2025 | $64 | $428,300 | $205,400 | $222,900 |
| 2024 | $6,095 | $410,700 | $205,400 | $205,300 |
| 2023 | $5,902 | $363,200 | $196,100 | $167,100 |
| 2022 | $5,981 | $337,700 | $196,100 | $141,600 |
| 2021 | $5,683 | $321,100 | $184,800 | $136,300 |
| 2020 | $5,116 | $287,900 | $157,500 | $130,400 |
| 2019 | $4,841 | $265,400 | $133,500 | $131,900 |
| 2018 | $4,698 | $259,000 | $136,900 | $122,100 |
| 2017 | $4,300 | $236,900 | $130,100 | $106,800 |
| 2016 | $4,189 | $236,800 | $130,100 | $106,700 |
| 2015 | $4,094 | $226,200 | $113,000 | $113,200 |
Source: Public Records
Map
Nearby Homes
- 115 Goldsmith St
- 4 Mars Place
- 55 Jennifer St
- 12 Paula Beth St
- 34 Baldwin Hill Rd
- 8 Edsel Rd
- 10 Baldwin Hill Rd
- 336 King St Unit 105
- 16 Fletcher Ln
- 18 Long Lake Rd
- 35 Queen Rd
- 17 Hartwell Ave
- 305 Harwood Ave
- 5 Mill Park Place
- 5 Mill Park Place Unit 5
- 3 Mill Park Place
- 3 Mill Park Place Unit 3
- 84 Powers Rd
- 125 Concord Rd
- 18 Pleasant St
- 3 Florence St
- 10 Florence St
- 15 Andrea St
- 0 Lot 47 Douglas Rd
- 0 Lot 44 Cypress Ln
- Lot 5A Dean Ln
- Lot 24 Field Ln
- 111 Goldsmith St
- 11 Florence St
- 0 Lot 13 Fraser St
- Lot 14 Vint Ln
- 10 Andrea St
- 109 Goldsmith St
- 19 Andrea St
- 18 Florence St
- 14 Andrea St
- 2 Tajlea Rd Unit 2
- 1 Tajlea Rd Unit 1
- 15 Florence St
- 101 Goldsmith St