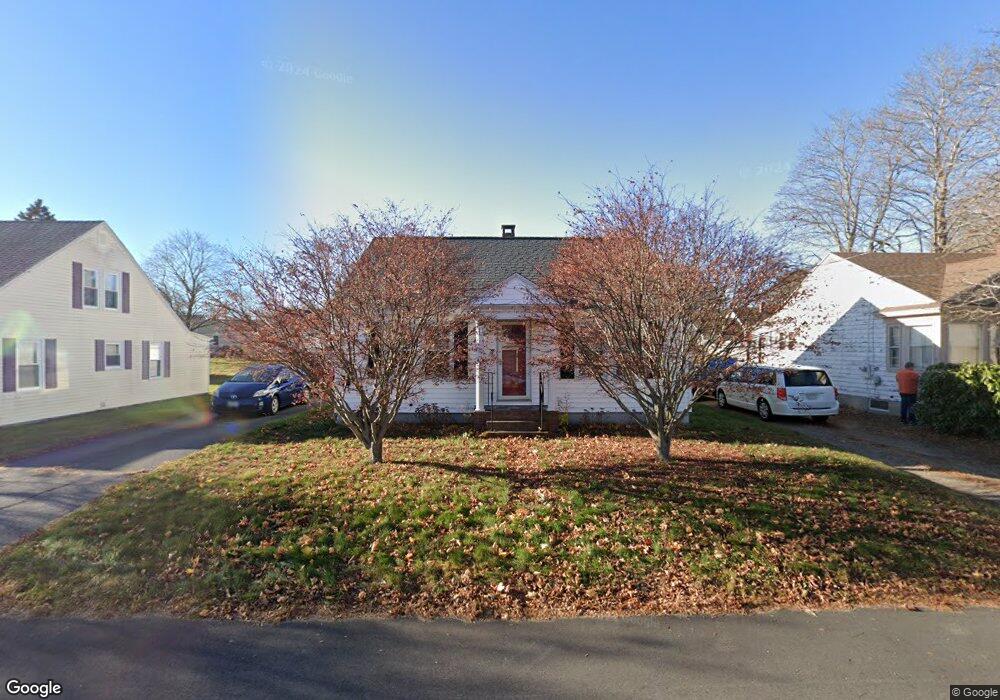
7 Fogg Ave Biddeford, ME 04005
Estimated Value: $378,000 - $413,000
2
Beds
2
Baths
900
Sq Ft
$444/Sq Ft
Est. Value
About This Home
This home is located at 7 Fogg Ave, Biddeford, ME 04005 and is currently estimated at $399,954, approximately $444 per square foot. 7 Fogg Ave is a home located in York County with nearby schools including John F Kennedy Memorial School, Biddeford Primary School, and Biddeford Intermediate School.
Ownership History
Date
Name
Owned For
Owner Type
Purchase Details
Closed on
Sep 20, 2022
Sold by
Shea Lucienne R and Shea Gregory
Bought by
Ingle Desmond
Current Estimated Value
Home Financials for this Owner
Home Financials are based on the most recent Mortgage that was taken out on this home.
Original Mortgage
$328,932
Outstanding Balance
$314,180
Interest Rate
5.22%
Mortgage Type
FHA
Estimated Equity
$85,774
Create a Home Valuation Report for This Property
The Home Valuation Report is an in-depth analysis detailing your home's value as well as a comparison with similar homes in the area
Home Values in the Area
Average Home Value in this Area
Purchase History
| Date | Buyer | Sale Price | Title Company |
|---|---|---|---|
| Ingle Desmond | $335,000 | Stewart Title |
Source: Public Records
Mortgage History
| Date | Status | Borrower | Loan Amount |
|---|---|---|---|
| Open | Ingle Desmond | $328,932 |
Source: Public Records
Tax History Compared to Growth
Tax History
| Year | Tax Paid | Tax Assessment Tax Assessment Total Assessment is a certain percentage of the fair market value that is determined by local assessors to be the total taxable value of land and additions on the property. | Land | Improvement |
|---|---|---|---|---|
| 2024 | $4,081 | $287,000 | $131,400 | $155,600 |
| 2023 | $3,735 | $284,700 | $129,100 | $155,600 |
| 2022 | $3,559 | $216,900 | $75,200 | $141,700 |
| 2021 | $2,917 | $185,000 | $63,600 | $121,400 |
| 2020 | $10,050 | $169,600 | $57,800 | $111,800 |
| 2019 | $4,181 | $169,600 | $57,800 | $111,800 |
| 2018 | $12,753 | $169,600 | $57,800 | $111,800 |
| 2017 | $3,115 | $155,200 | $57,800 | $97,400 |
| 2016 | $3,082 | $155,200 | $57,800 | $97,400 |
| 2015 | $2,827 | $155,200 | $57,800 | $97,400 |
| 2014 | $2,757 | $155,200 | $57,800 | $97,400 |
| 2013 | -- | $163,100 | $57,100 | $106,000 |
Source: Public Records
Map
Nearby Homes