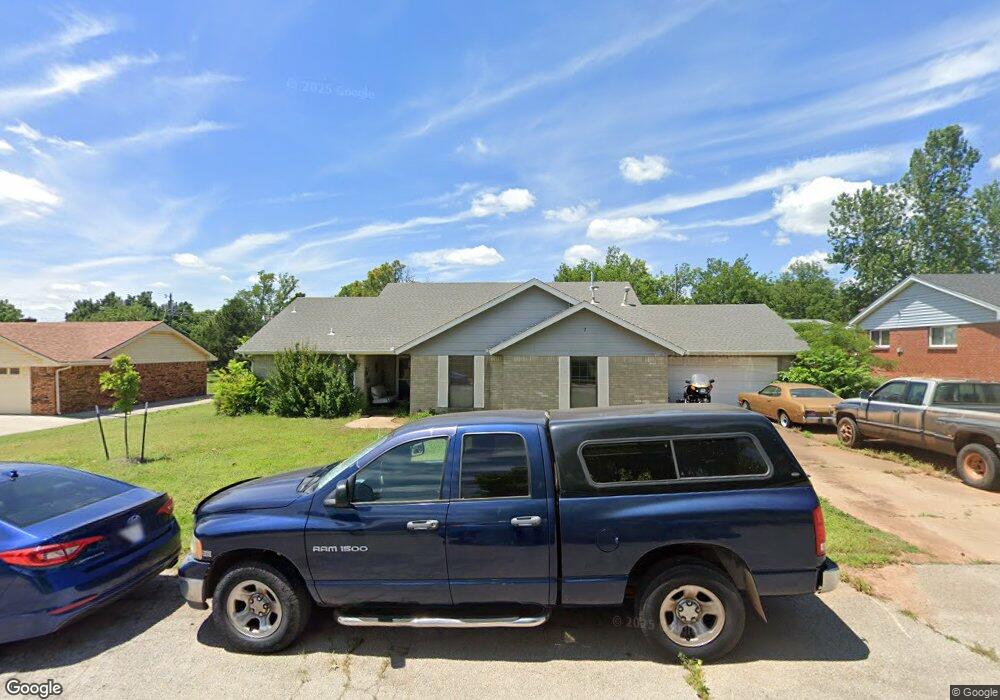
7 Forrest Rd Guthrie, OK 73044
East Guthrie NeighborhoodEstimated Value: $214,000 - $258,000
3
Beds
2
Baths
1,746
Sq Ft
$134/Sq Ft
Est. Value
About This Home
This home is located at 7 Forrest Rd, Guthrie, OK 73044 and is currently estimated at $234,252, approximately $134 per square foot. 7 Forrest Rd is a home located in Logan County with nearby schools including Central Elementary School, Fogarty Elementary School, and Cotteral Elementary School.
Ownership History
Date
Name
Owned For
Owner Type
Purchase Details
Closed on
Apr 29, 2011
Sold by
Robinson Joshua
Bought by
Horn Darrell R and Horn Christy M
Current Estimated Value
Home Financials for this Owner
Home Financials are based on the most recent Mortgage that was taken out on this home.
Original Mortgage
$145,136
Outstanding Balance
$100,224
Interest Rate
4.82%
Mortgage Type
VA
Estimated Equity
$134,028
Purchase Details
Closed on
Jun 11, 2008
Sold by
Financial Corp
Bought by
Robison Joshua
Home Financials for this Owner
Home Financials are based on the most recent Mortgage that was taken out on this home.
Original Mortgage
$118,755
Interest Rate
6.05%
Mortgage Type
FHA
Purchase Details
Closed on
May 30, 2008
Sold by
Maples Levi and Maples Lehn
Bought by
Cartus Financial Corp
Home Financials for this Owner
Home Financials are based on the most recent Mortgage that was taken out on this home.
Original Mortgage
$118,755
Interest Rate
6.05%
Mortgage Type
FHA
Create a Home Valuation Report for This Property
The Home Valuation Report is an in-depth analysis detailing your home's value as well as a comparison with similar homes in the area
Home Values in the Area
Average Home Value in this Area
Purchase History
| Date | Buyer | Sale Price | Title Company |
|---|---|---|---|
| Horn Darrell R | $141,000 | None Available | |
| Robison Joshua | $139,000 | Oklahoma Title &Closing Co | |
| Cartus Financial Corp | $139,000 | Multipal |
Source: Public Records
Mortgage History
| Date | Status | Borrower | Loan Amount |
|---|---|---|---|
| Open | Horn Darrell R | $145,136 | |
| Previous Owner | Robison Joshua | $118,755 | |
| Previous Owner | Cartus Financial Corp | $118,755 |
Source: Public Records
Tax History
| Year | Tax Paid | Tax Assessment Tax Assessment Total Assessment is a certain percentage of the fair market value that is determined by local assessors to be the total taxable value of land and additions on the property. | Land | Improvement |
|---|---|---|---|---|
| 2025 | $1,639 | $18,128 | $2,916 | $15,212 |
| 2024 | $1,564 | $17,600 | $2,916 | $14,684 |
| 2023 | $1,564 | $17,088 | $2,916 | $14,172 |
| 2022 | $1,436 | $16,590 | $2,916 | $13,674 |
| 2021 | $1,400 | $16,107 | $2,916 | $13,191 |
| 2020 | $1,359 | $15,638 | $2,916 | $12,722 |
| 2019 | $1,364 | $15,638 | $2,916 | $12,722 |
| 2018 | $1,323 | $15,638 | $2,916 | $12,722 |
| 2017 | $1,326 | $15,940 | $2,916 | $13,024 |
| 2016 | $1,321 | $15,476 | $2,916 | $12,560 |
| 2014 | $1,173 | $16,382 | $2,090 | $14,292 |
| 2013 | $1,033 | $17,502 | $2,280 | $15,222 |
Source: Public Records
Map
Nearby Homes
- 0009 S Post Rd
- 27501 N Midwest Blvd
- 3077 E College Ave Unit Tract B
- 3077 E College Ave Unit Tract A
- 860 Creekside Trail
- 900 Creekside Trail
- 841 Meadow Park Rd
- 861 Meadow Park Rd
- 881 Meadow Park Rd
- 940 Creekside Trail
- 960 Creekside Trail
- 0001 University Ave
- 1000 Creekside Trail
- 980 Creekside Trail
- 901 Meadow Park Rd
- 921 Meadow Park Rd
- 1060 Creekside Trail
- 1001 Meadow Park Rd
- 981 Meadow Park Rd
- 1101 Creekside Trail
Your Personal Tour Guide
Ask me questions while you tour the home.