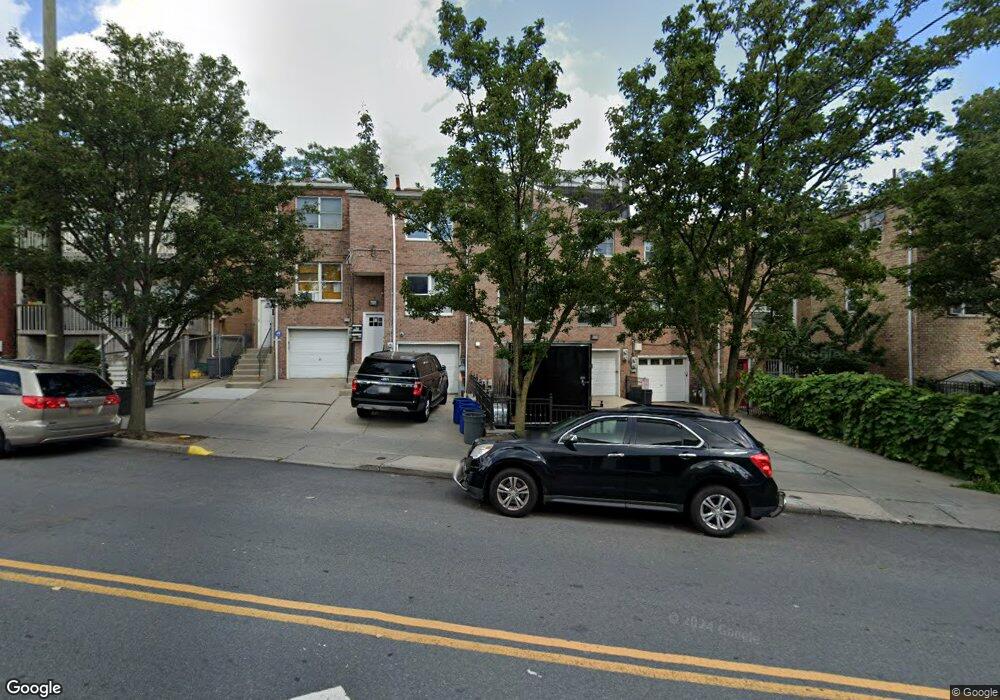
7 Fort Place Staten Island, NY 10301
Saint George NeighborhoodEstimated Value: $525,000 - $668,000
--
Bed
--
Bath
1,750
Sq Ft
$333/Sq Ft
Est. Value
About This Home
This home is located at 7 Fort Place, Staten Island, NY 10301 and is currently estimated at $581,906, approximately $332 per square foot. 7 Fort Place is a home located in Richmond County with nearby schools including P.S. 16 John J Driscoll, Fort Hill Collaborative Elementary, and P.S. 74 Future Leaders Elementary School.
Ownership History
Date
Name
Owned For
Owner Type
Purchase Details
Closed on
Jun 6, 2016
Sold by
Lanzi Olivia Robina
Bought by
Lanzi Anthony J
Current Estimated Value
Home Financials for this Owner
Home Financials are based on the most recent Mortgage that was taken out on this home.
Original Mortgage
$294,556
Outstanding Balance
$234,434
Interest Rate
3.57%
Mortgage Type
FHA
Estimated Equity
$347,472
Purchase Details
Closed on
Jan 28, 2008
Sold by
Fernandez Rose Marie and The Estate Of Alvaro E Fernand
Bought by
Lanzi Olivia Robina
Home Financials for this Owner
Home Financials are based on the most recent Mortgage that was taken out on this home.
Original Mortgage
$315,000
Interest Rate
6.14%
Mortgage Type
Purchase Money Mortgage
Purchase Details
Closed on
May 11, 1999
Sold by
Emerald Estates Ltd
Bought by
Fernandez Alvaro
Home Financials for this Owner
Home Financials are based on the most recent Mortgage that was taken out on this home.
Original Mortgage
$80,000
Interest Rate
7.61%
Create a Home Valuation Report for This Property
The Home Valuation Report is an in-depth analysis detailing your home's value as well as a comparison with similar homes in the area
Home Values in the Area
Average Home Value in this Area
Purchase History
| Date | Buyer | Sale Price | Title Company |
|---|---|---|---|
| Lanzi Anthony J | $300,000 | The Security Title Guarantee | |
| Lanzi Olivia Robina | $365,000 | Titlevest | |
| Fernandez Alvaro | $163,000 | Chicago Title Insurance Co |
Source: Public Records
Mortgage History
| Date | Status | Borrower | Loan Amount |
|---|---|---|---|
| Open | Lanzi Anthony J | $294,556 | |
| Previous Owner | Lanzi Olivia Robina | $315,000 | |
| Previous Owner | Fernandez Alvaro | $80,000 |
Source: Public Records
Tax History Compared to Growth
Tax History
| Year | Tax Paid | Tax Assessment Tax Assessment Total Assessment is a certain percentage of the fair market value that is determined by local assessors to be the total taxable value of land and additions on the property. | Land | Improvement |
|---|---|---|---|---|
| 2025 | $4,582 | $35,340 | $4,270 | $31,070 |
| 2024 | $4,582 | $33,000 | $4,314 | $28,686 |
| 2023 | $4,371 | $21,522 | $4,423 | $17,099 |
| 2022 | $4,053 | $30,660 | $6,240 | $24,420 |
| 2021 | $4,273 | $26,220 | $6,240 | $19,980 |
| 2020 | $4,266 | $28,980 | $6,240 | $22,740 |
| 2019 | $3,977 | $26,460 | $6,240 | $20,220 |
| 2018 | $3,656 | $17,935 | $4,832 | $13,103 |
| 2017 | $3,449 | $16,920 | $6,240 | $10,680 |
| 2016 | $3,610 | $18,060 | $6,240 | $11,820 |
| 2015 | $3,646 | $19,141 | $4,956 | $14,185 |
| 2014 | $3,646 | $18,996 | $4,540 | $14,456 |
Source: Public Records
Map
Nearby Homes
- 50 Fort Place Unit A3J
- 50 Fort Place Unit B4B
- 50 Fort Place Unit A6B
- 50 Fort Place Unit B3AB
- 50 Fort Place Unit B3C
- 50 Fort Place Unit B4C
- 165 Daniel Low Terrace
- 102 Montgomery Ave
- 77 Montgomery Ave
- 83 Montgomery Ave
- 87 Montgomery Ave
- 0 Bay St Unit 2503634
- 99 Monroe Ave
- 46 Bay St Unit Q1F
- 103 Monroe Ave
- 109 Monroe Ave
- 301 Westervelt Ave
- 80 Bay St Unit 4a
- 80 Bay St Unit 3K
- 90 Bay St Unit 4-J
- 5 Fort Place
- 9 Fort Place
- 11 Fort Place
- 304 Saint Marks Place
- 302 Saint Marks Place
- 306 Saint Marks Place
- 308 Saint Marks Place
- 15 Fort Place
- 300 Saint Marks Place
- 300 Saint Marks Place Unit 2
- 19 Fort Place
- 17 Fort Place
- 115 Belmont Place
- 22 Fort Place
- 320 Montgomery Ave
- 6 Montgomery Ave
- 307 St Mark's Place
- 8 Montgomery Ave
- 27 Fort Place
- 28 Fort Place